Submit an Article
Navigate
Home
Editorial Board
Editorial Policies
Current Volume
Archive
Scientific Integrity
Publication Ethics Statements
Interviews with Outstanding Authors
Newsroom
Sponsored Conferences
Podcast
Contact
Special Collections
Submit an Article
Online ISSN: 1945-4589
Research Paper
|
Volume 14, Issue 3
|
pp. 1307–1320
Inhibiting effect of miR-29 on proliferation and migration of uterine leiomyoma via the STAT3 signaling pathway
Back to article
Figure 1
(1 of 6)
−
100%
+
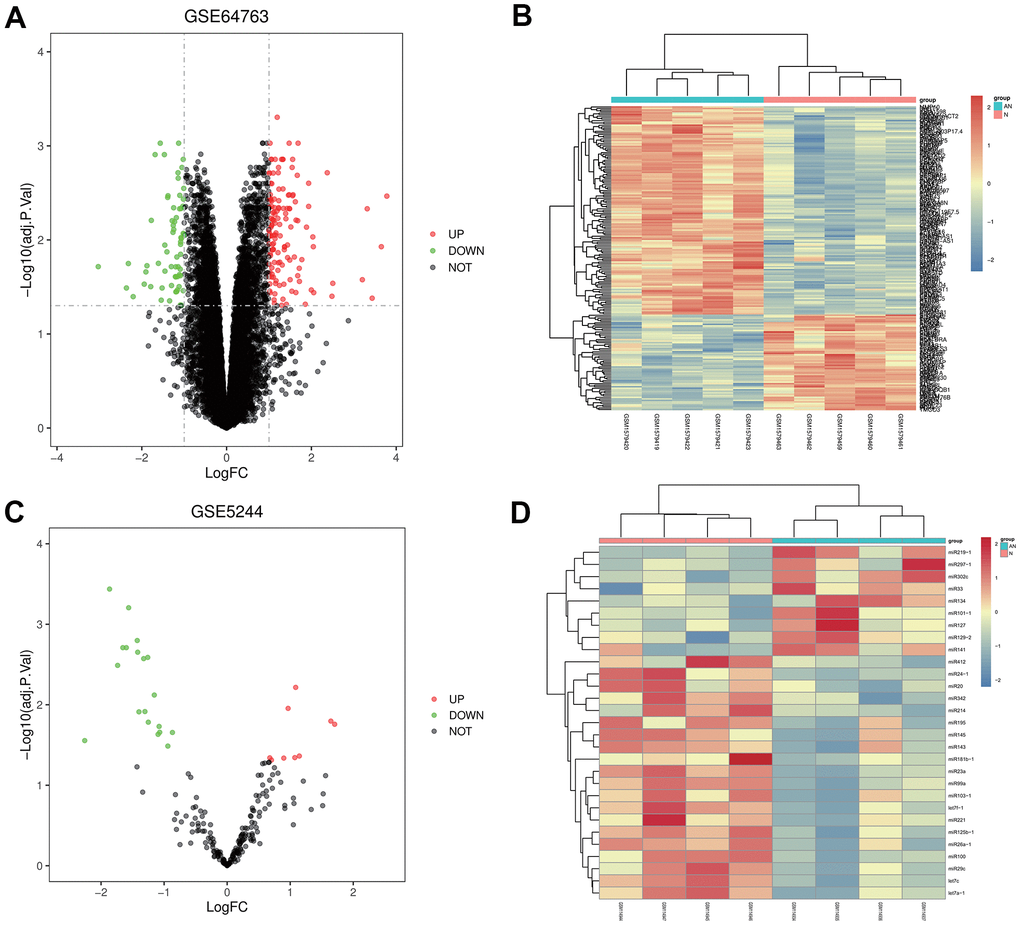
Figure 1.
Screening of differentially expressed genes (DEGs).
(
A
,
B
) Volcanic map and heatmap of DEGs in GSE64763. (
C
,
D
) Volcanic map and heatmap in GSE5244.