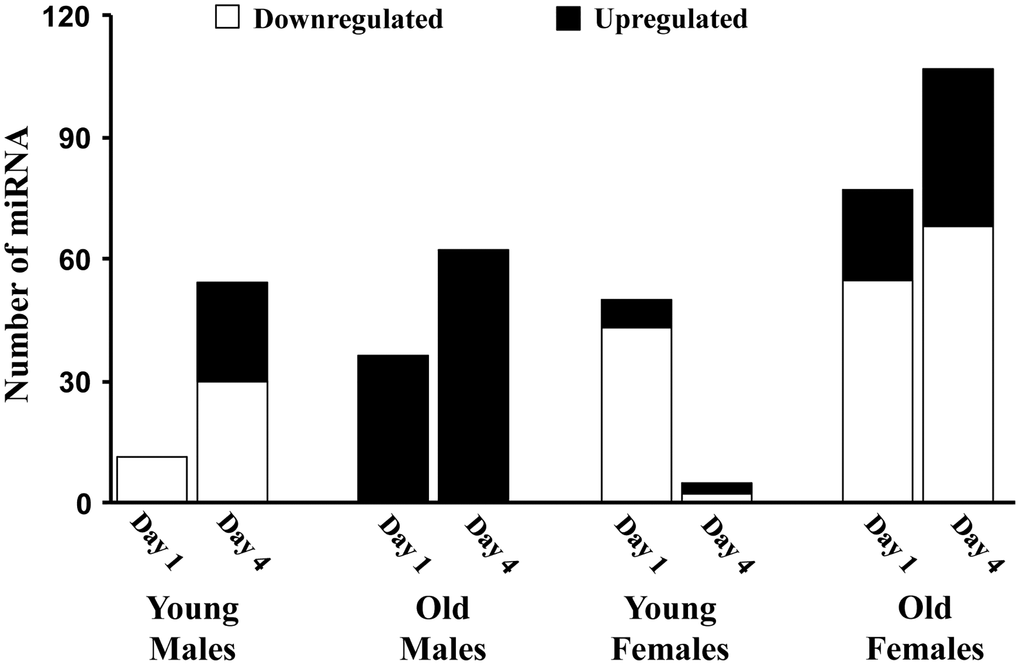
Figure 2.The number of miRs differentially expressed for each age and sex group. Summary of the total number of miRs increased (black) or decreased (white) expression in the hippocampus 1 or 4 days after sepsis relative to age-matched controls.
Figure 2 — Influence of age and sex on microRNA response and recovery in the hippocampus following sepsis | Aging