Submit an Article
Navigate
Home
Editorial Board
Editorial Policies
Current Volume
Archive
Scientific Integrity
Publication Ethics Statements
Interviews with Outstanding Authors
Newsroom
Sponsored Conferences
Podcast
Contact
Special Collections
Submit an Article
Online ISSN: 1945-4589
Research Paper
|
Volume 14, Issue 3
|
pp. 1087–1109
The effect of age on ventilation management and clinical outcomes in critically ill COVID–19 patients––insights from the PRoVENT–COVID study
Back to article
Figure 2
(2 of 2)
−
100%
+
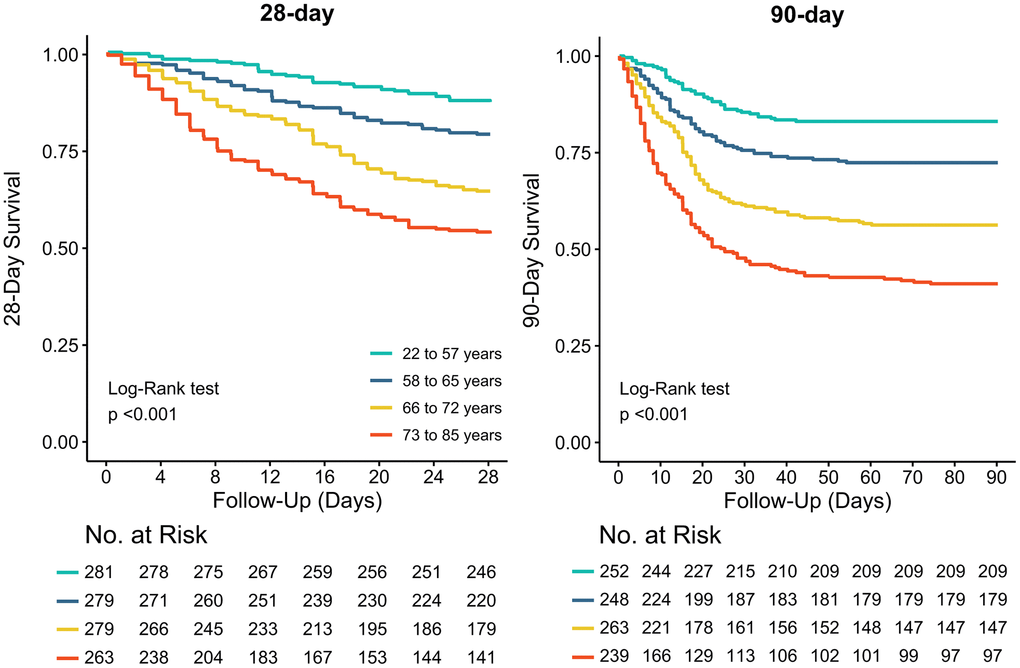
Figure 2.
Kaplan-Meier curves for 28-day and 90-day mortality per age group.
The Log-Rank test was used to calculate P values.