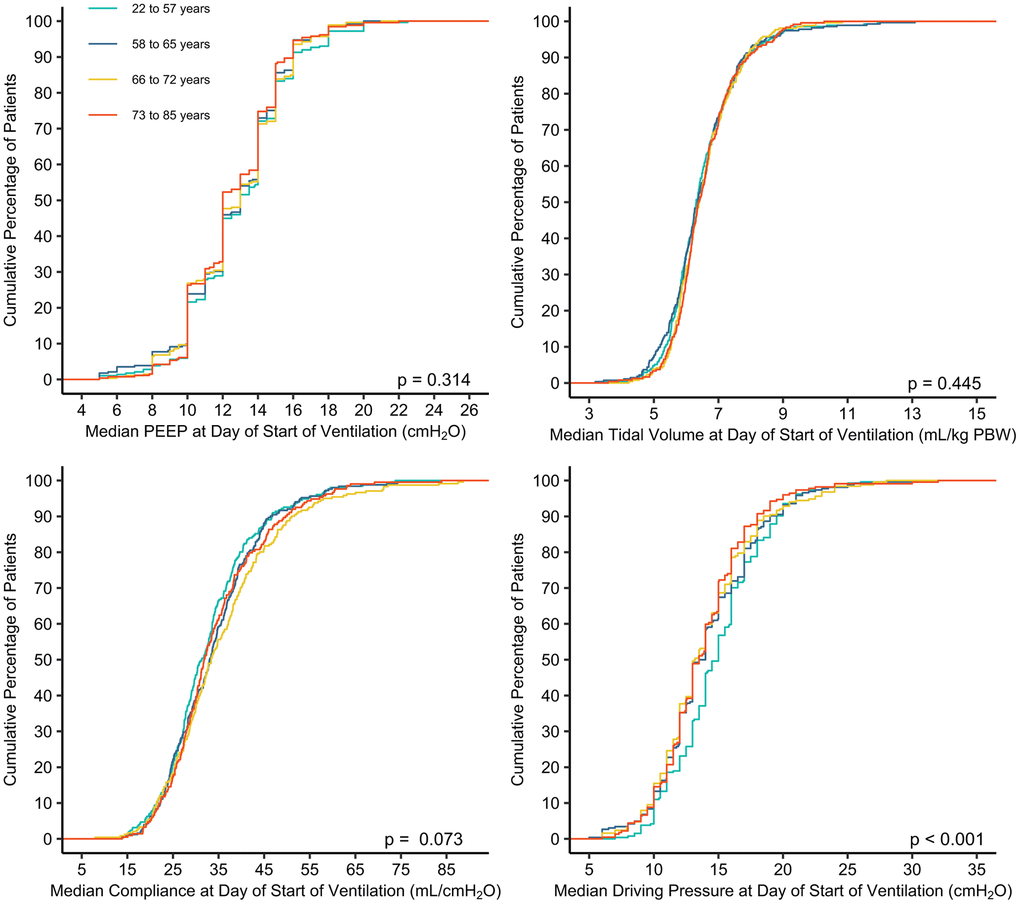
Figure 1.Cumulative frequency distribution of median PEEP, tidal volume, compliance and driving pressure at start day of invasive ventilation. Mean values were calculated from three or four measurements available on the first day of ventilation. The Kruskal-Wallis test was used to calculate p-values.