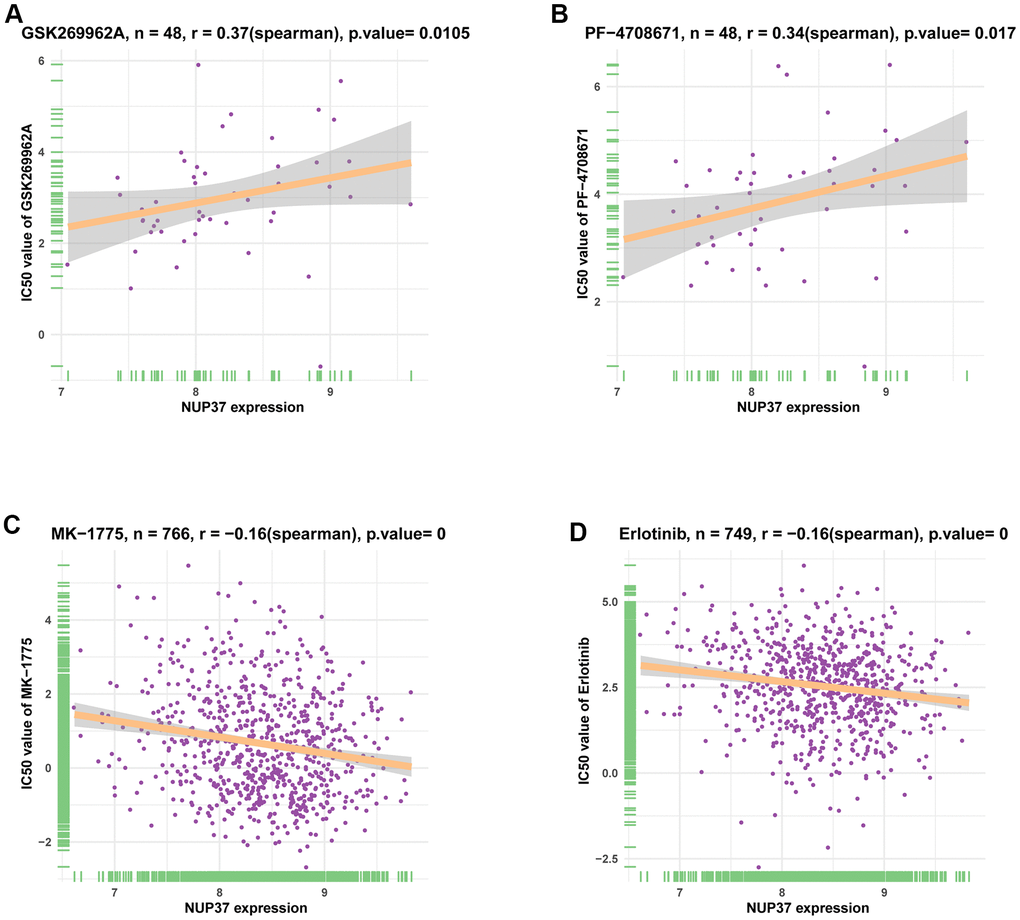
Figure 12.The correlation between NUP37 expression and IC50 values of anti-cancer drugs. (A–D) The correlation between NUP37 expression and IC50 values of indicated anti-cancer drugs.
Figure 12 — Pan-cancer analysis reveals NUP37 as a prognostic biomarker correlated with the immunosuppressive microenvironment in glioma | Aging