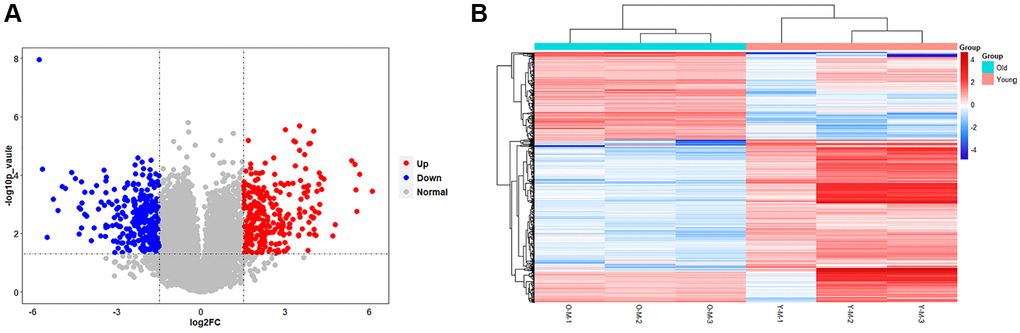
Figure 4.Results of statistical analysis of transcriptome differences. (A) Volcano plots of mRNAs. The volcanic map is drawn with -log10 (p-value) as the vertical axis and log2 (Fold Change) as the horizontal axis, which shows the changes of mRNA expression in the old BMSC group and the young BMSC group. The red dots represent up-regulated mRNAs and the blue dots represent down-regulated mRNAs, and the grey dots represent that the mRNAs were not significantly changed. (B) Heatmap of DEGs. Each row represents a sample and each column represents a mRNA. Red is the high expression level, blue is the low expression level.