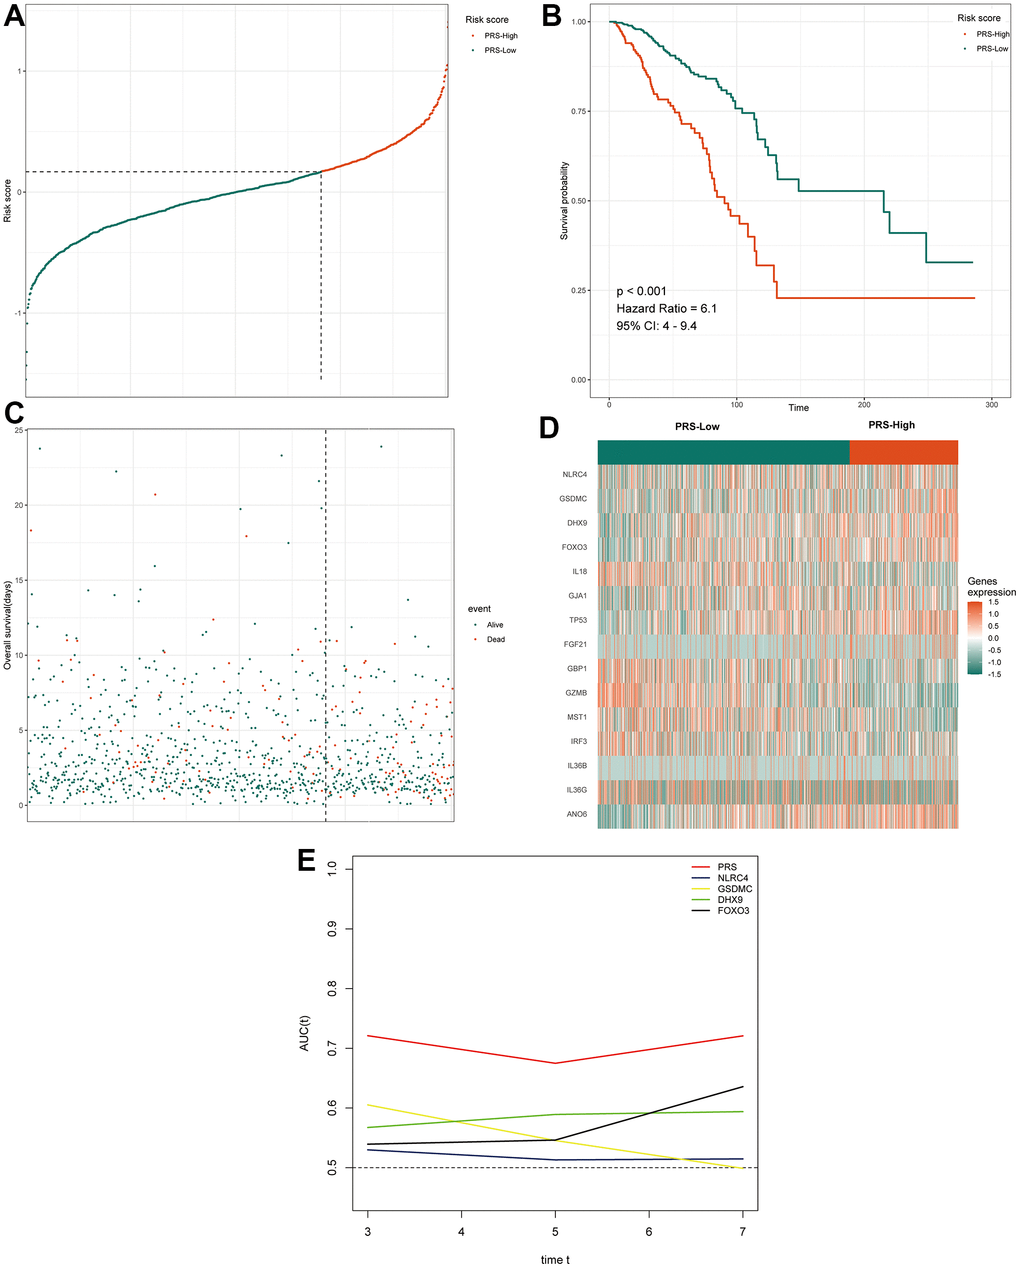
Figure 3.Prognostic analysis of the 15 pyroptosis-related gene signature model in TCGA cohort. (A) The distribution and cutoff value of the risk score in the TCGA cohort. (B) Kaplan–Meier curves for the OS of patients in the two groups in the TCGA cohort. (C) The distributions of OS status, OS and the risk score in the TCGA cohort. (D) Heatmap showing differences in the expression of 15 pyroptosis-related genes between high-PRS group and low-PRS group. (E) tROC analysis showed that the PRS was an accurate variable for survival prediction. The four genes shown in the figure have the four highest AUCs among the 15 signature genes. TCGA, The Cancer Genome Atlas; PRS, pyroptosis-related risk score; High-PRS, high pyroptosis-related risk score; Low-PRS, low pyroptosis-related risk score; OS, overall survival; tROC, time-dependent receiver operating characteristic; AUC, area under the curve.