Submit an Article
Navigate
Home
Editorial Board
Editorial Policies
Current Volume
Archive
Scientific Integrity
Publication Ethics Statements
Interviews with Outstanding Authors
Newsroom
Sponsored Conferences
Podcast
Contact
Special Collections
Submit an Article
Online ISSN: 1945-4589
Research Paper
|
Volume 14, Issue 2
|
pp. 975–988
The prevalence of small intestinal bacterial overgrowth in diabetes mellitus: a systematic review and meta-analysis
Back to article
Figure 5
(5 of 9)
−
100%
+
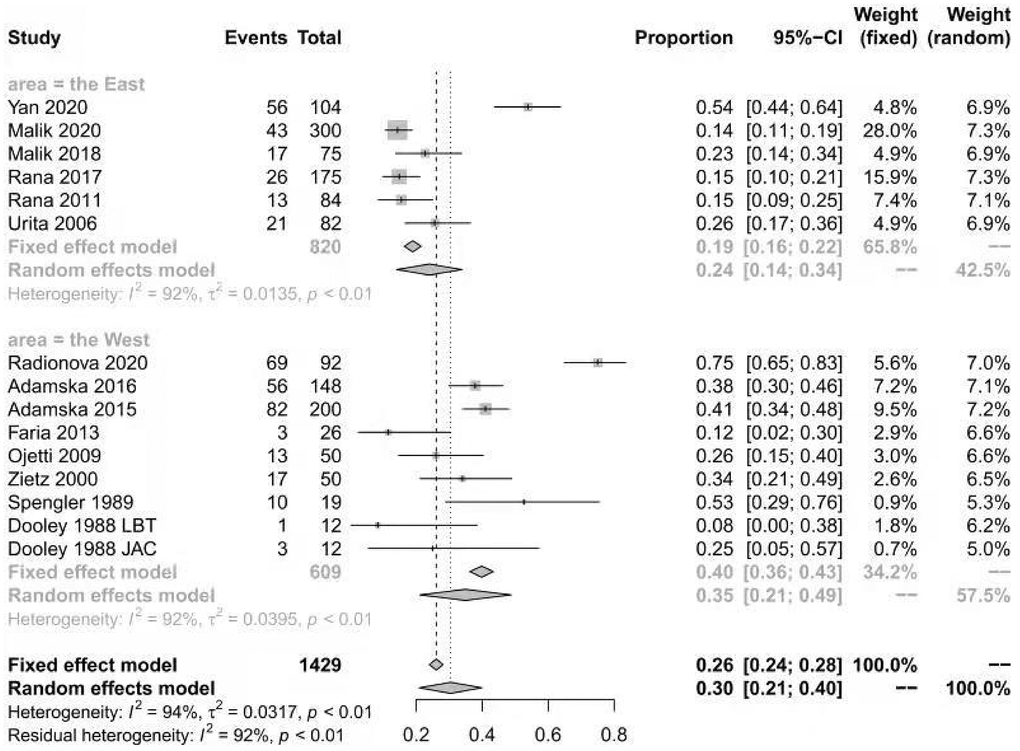
Figure 5.
Forest plot of the prevalence of SIBO in DM based on geographic areas.