Submit an Article
Navigate
Home
Editorial Board
Editorial Policies
Current Volume
Archive
Scientific Integrity
Publication Ethics Statements
Interviews with Outstanding Authors
Newsroom
Sponsored Conferences
Podcast
Contact
Special Collections
Submit an Article
Online ISSN: 1945-4589
Research Paper
|
Volume 14, Issue 2
|
pp. 923–942
Age-related alterations of brain metabolic network based on [18F]FDG-PET of rats
Back to article
Figure 2
(2 of 10)
−
100%
+
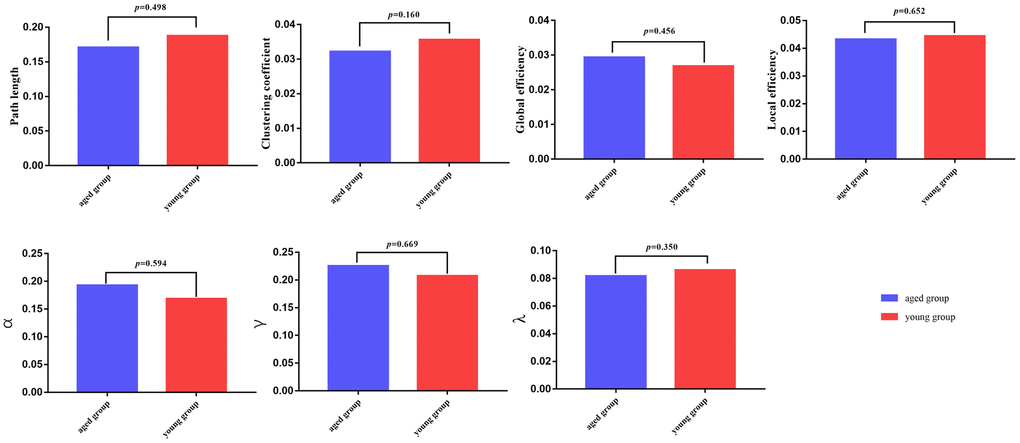
Figure 2.
Global parameters are displayed in the bar chart, with blue bars for the aged rats and red bars for the young rats.
In all of the parameters, no significant differences were found between the aged group and young group.