Submit an Article
Navigate
Home
Editorial Board
Editorial Policies
Current Volume
Archive
Scientific Integrity
Publication Ethics Statements
Interviews with Outstanding Authors
Newsroom
Sponsored Conferences
Podcast
Contact
Special Collections
Submit an Article
Online ISSN: 1945-4589
Research Paper
|
Volume 14, Issue 2
|
pp. 923–942
Age-related alterations of brain metabolic network based on [18F]FDG-PET of rats
Back to article
Figure 10
(10 of 10)
−
100%
+
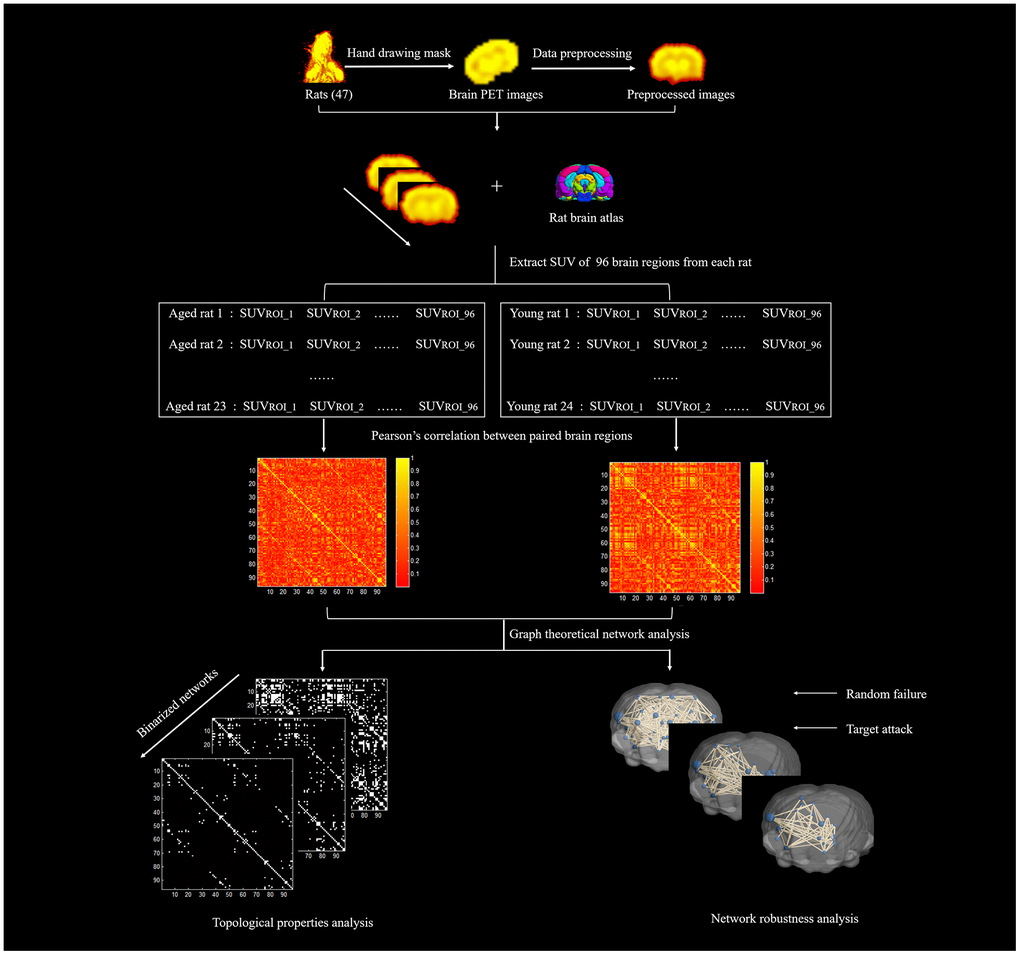
Figure 10.
The diagram of network construction and analysis.
Figure 10 — Age-related alterations of brain metabolic network based on [18F]FDG-PET of rats | Aging