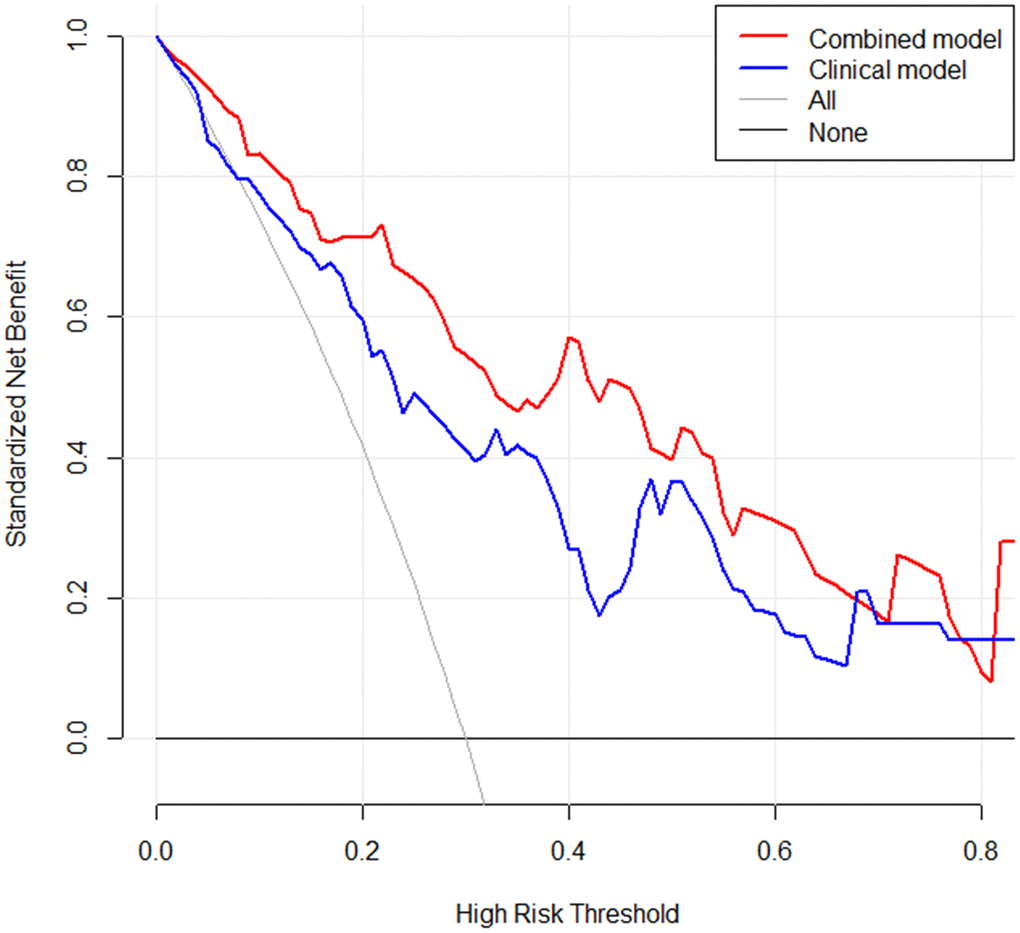
Figure 7.A decision curve was applied to compare the difference in net benefit of the clinical model and radiomics model in the validation cohort. X-axis means threshold probability, Y-axis means net benefit. The decision curve showed that when the threshold probability exceeds 10%, and the net benefit of clinical application in radiomics model would exceed the clinical model.