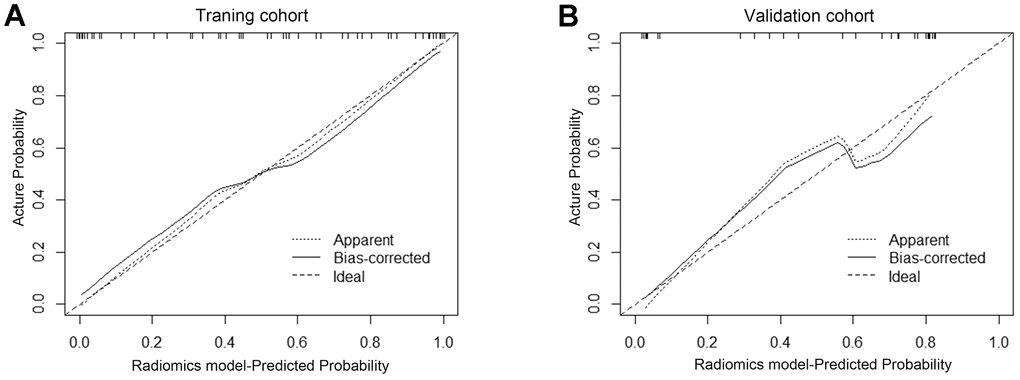
Figure 6.The calibration curve showed the consistency between the predicted and observed probabilities. Calibration curves were plotted in the training set (A) and in the validation set (B). The 45-degree reference line represents an ideal standard calibration line. The solid line represents the prediction performance of the radiomics model without overfitting correction. The dotted line is the performance of the nomogram after bootstrap correction, which is used as the prediction of future accuracy. The closer the prediction curve is to the standard curve, the better the prediction ability of the nomogram.