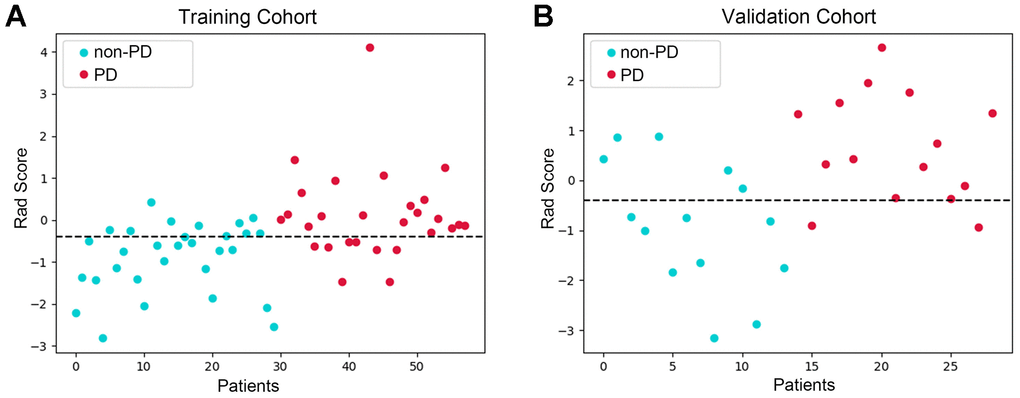
Figure 3.Differences in rad-scores between anti-PD1 treatment responders were detected. Scatter plot of the rad-score in the training set (A) and in the validation set (B). The blue dots represent the rad-score of patients with PD, and red dots represent the rad-score of patients without PD. Our analyses revealed that the patients with PD after immunotherapy had obviously higher rad-scores than those without PD in the training and validation set.