Submit an Article
Navigate
Home
Editorial Board
Editorial Policies
Current Volume
Archive
Scientific Integrity
Publication Ethics Statements
Interviews with Outstanding Authors
Newsroom
Sponsored Conferences
Podcast
Contact
Special Collections
Submit an Article
Online ISSN: 1945-4589
Research Paper
|
Volume 14, Issue 2
|
pp. 660–677
Comparing qPCR and DNA methylation-based measurements of telomere length in a high-risk pediatric cohort
Back to article
Figure 2
(2 of 3)
−
100%
+
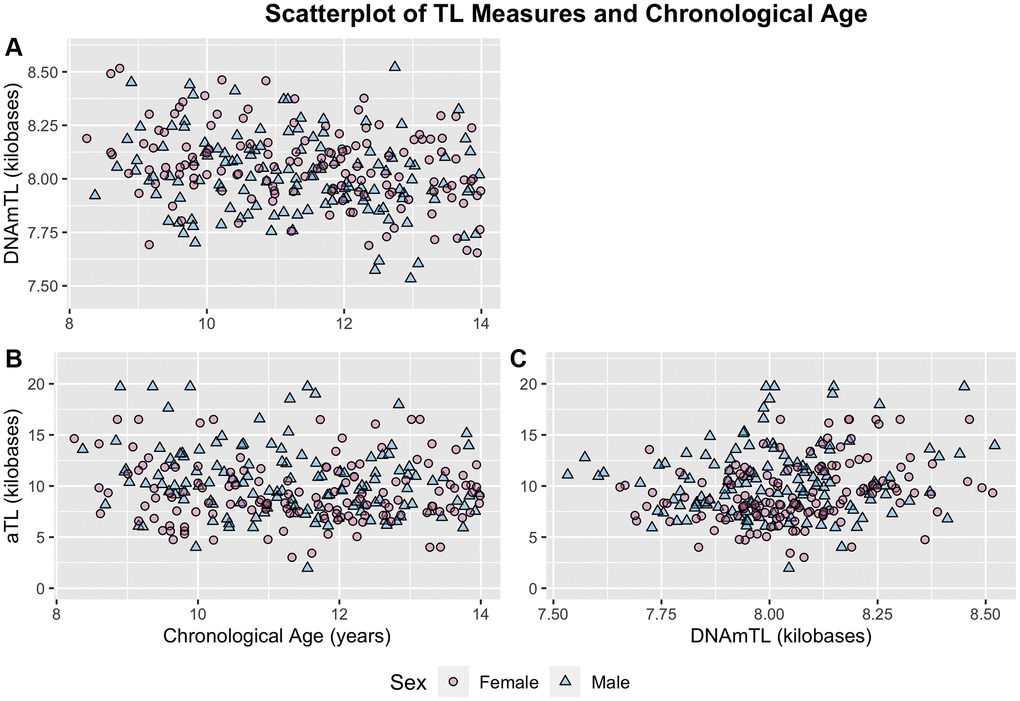
Figure 2.
Scatterplots of chronological age and TL measures distinguished by sex.
(
A
) DNAmTL and chronological age. (
B
) aTL and chronological age. (
C
) aTL and DNAmTL. Females and males distinguished by pink circles and blue triangles respectively.