Submit an Article
Navigate
Home
Editorial Board
Editorial Policies
Current Volume
Archive
Scientific Integrity
Publication Ethics Statements
Interviews with Outstanding Authors
Newsroom
Sponsored Conferences
Podcast
Contact
Special Collections
Submit an Article
Online ISSN: 1945-4589
Research Paper
|
Volume 14, Issue 2
|
pp. 660–677
Comparing qPCR and DNA methylation-based measurements of telomere length in a high-risk pediatric cohort
Back to article
Figure 1
(1 of 3)
−
100%
+
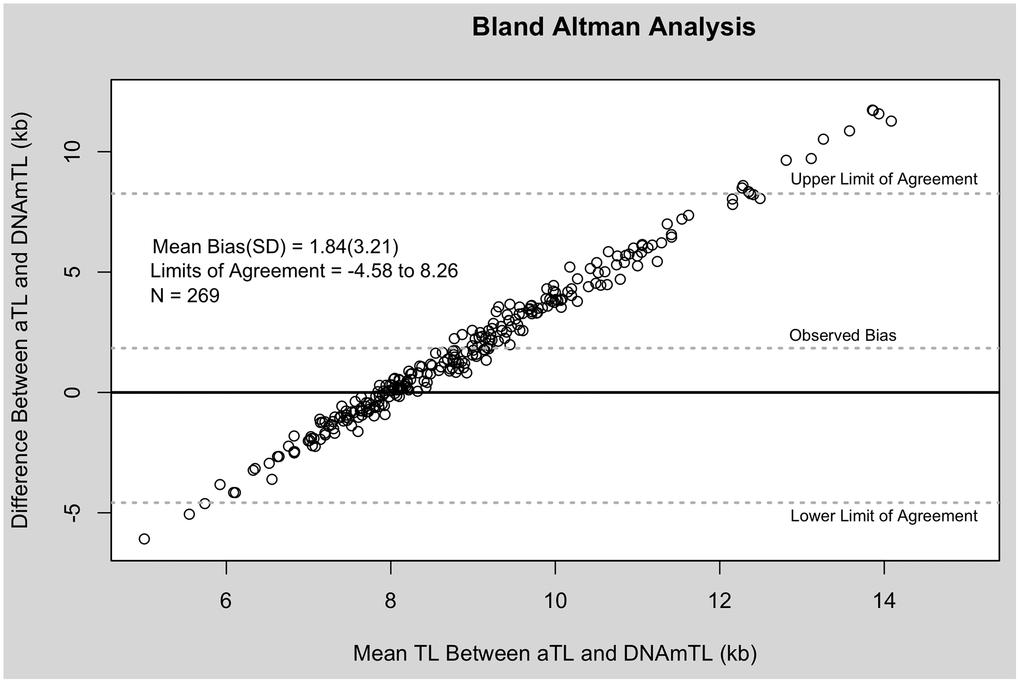
Figure 1.
Bland Altman analysis of aTL and DNAmTL.
X-axis represents the average of the two measures. The Y-axis represents the difference between the two measures. Each point corresponds to one paired comparison.