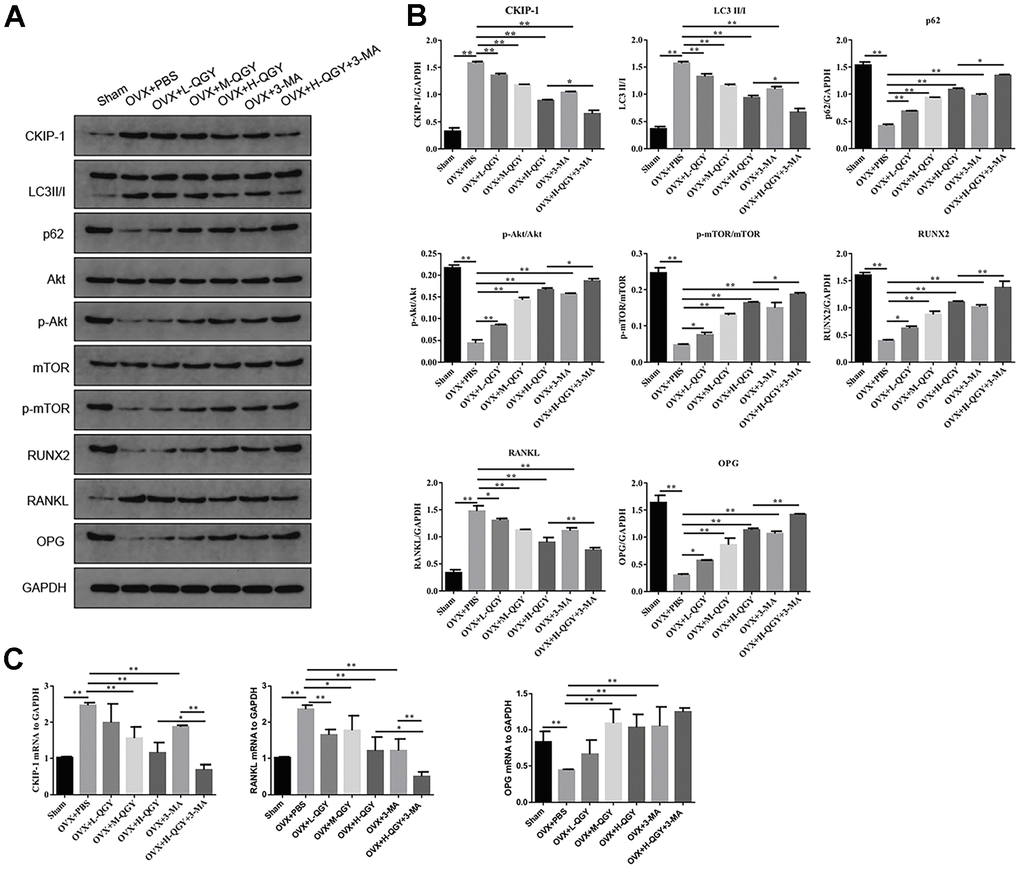
Figure 3.The effect of QGY on the protein expression of femoral tissue in osteoporotic rats. (A, B) Representative figures (A) and quantitative analysis (B) of protein expression of CKIP-1, LC3II/I, p62, p-AKT/AKT, p-mTOR/mTOR, RUNX2, RANKL and OPG. (C) Gene expression levels of CKIP-1, RANKL and OPG. The data are presented as the means ± SD (n=5). *p<0.05, **p<0.01. One-way ANOVA followed by Tukey's post hoc test.