Submit an Article
Navigate
Home
Editorial Board
Editorial Policies
Current Volume
Archive
Scientific Integrity
Publication Ethics Statements
Interviews with Outstanding Authors
Newsroom
Sponsored Conferences
Podcast
Contact
Special Collections
Submit an Article
Online ISSN: 1945-4589
Research Paper
|
Volume 14, Issue 2
|
pp. 869–891
Novel necroptosis-related gene signature for predicting the prognosis of pancreatic adenocarcinoma
Back to article
Figure 6
(6 of 11)
−
100%
+
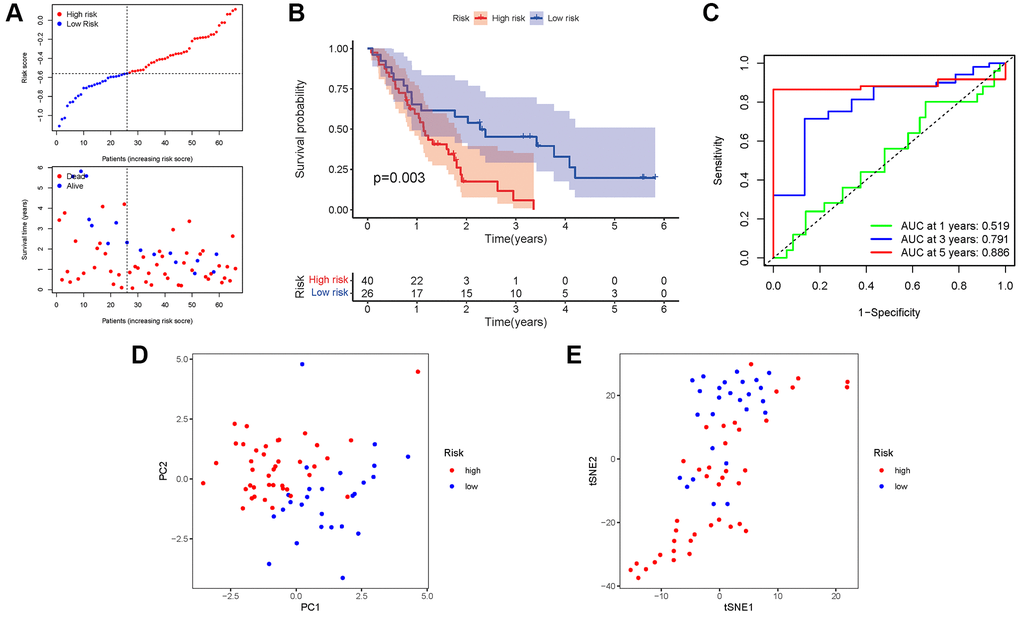
Figure 6.
Validation of the risk model in the GEO cohort.
(
A
) Risk survival status plot. (
B
) Kaplan–Meier curve result. (
C
) The AUC of the prediction of 1, 3, 5-year survival rate of PAAD. (
D
) PCA plot. (
E
) t-SNE plot.