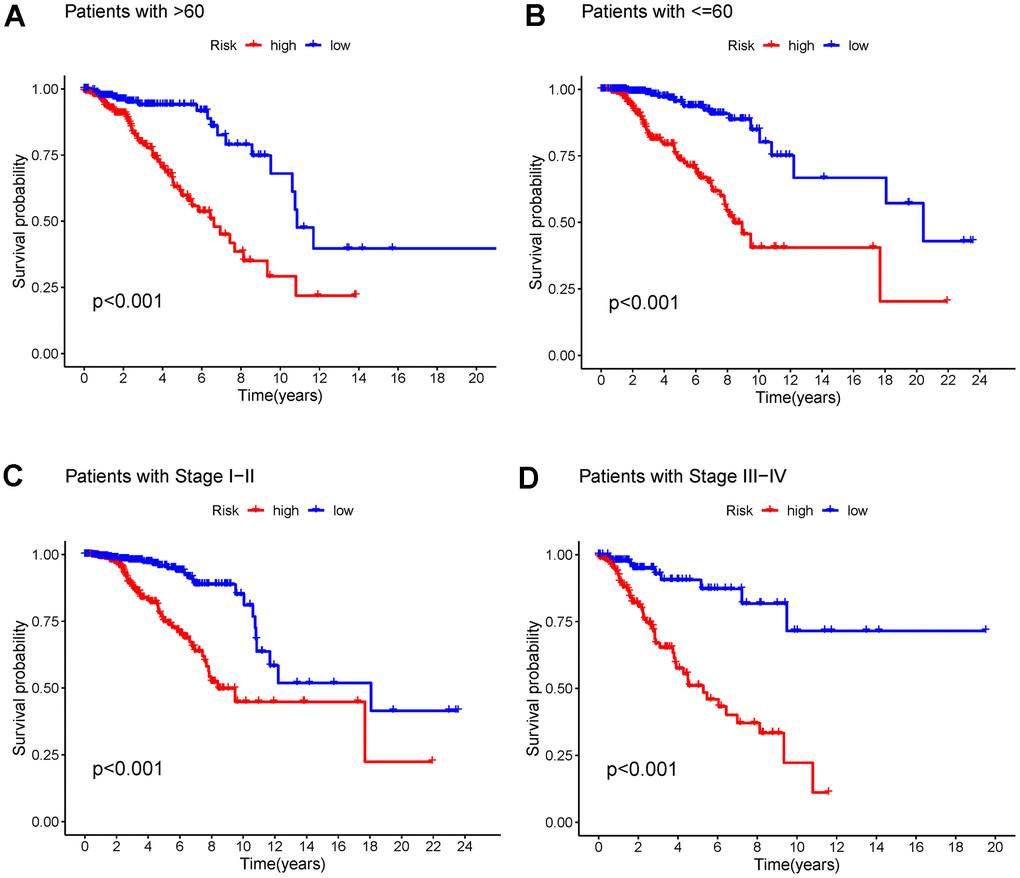
Figure 7.(A, B) K-M curves of OS for breast cancer patients age >60 and age ≤60 in the low- and high-risk groups. (C, D) K-M curves of OS for stage I-II and stage III-IV breast cancer in the low- and high-risk groups. Abbreviations: K-M: Kaplan-Meier; OS: overall survival.