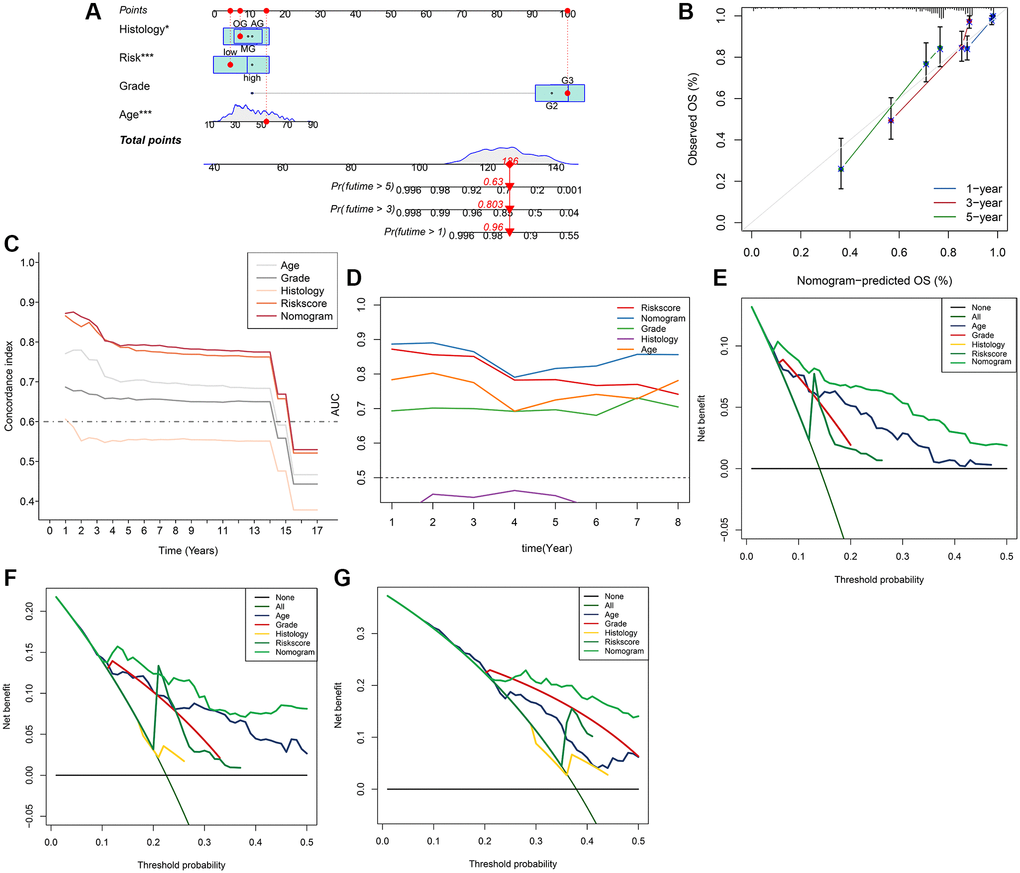
Figure 9.Nomogram model for the prediction of LGG prognosis for 1-year, 3-year, 5-year OS in the whole set. (A) Nomogram of applied to predict survival. (B) Calibration curve. (C) Graph showing concordance index changes over time. (D) AUC values of time-dependent ROC curves changes over time. (E–G) Decision curve analysis for 1-year, 3-year, 5-year OS.