Submit an Article
Navigate
Home
Editorial Board
Editorial Policies
Current Volume
Archive
Scientific Integrity
Publication Ethics Statements
Interviews with Outstanding Authors
Newsroom
Sponsored Conferences
Podcast
Contact
Special Collections
Submit an Article
Online ISSN: 1945-4589
Research Paper
|
Volume 14, Issue 2
|
pp. 826–844
A new signature based on alternative polyadenylation for prognostic prediction and therapeutic responses in low-grade glioma
Back to article
Figure 5
(5 of 10)
−
100%
+
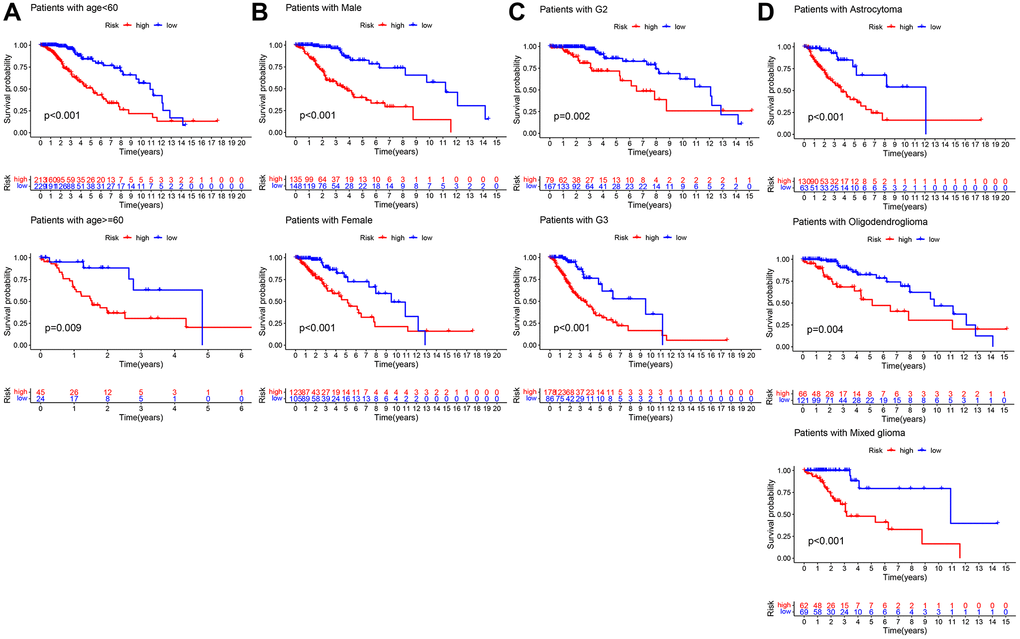
Figure 5.
Kaplan–Meier survival curves of LGG patients in different clinical subgroups.
(
A
) age. (
B
) Gender. (
C
) Grade. (
D
) Histology.