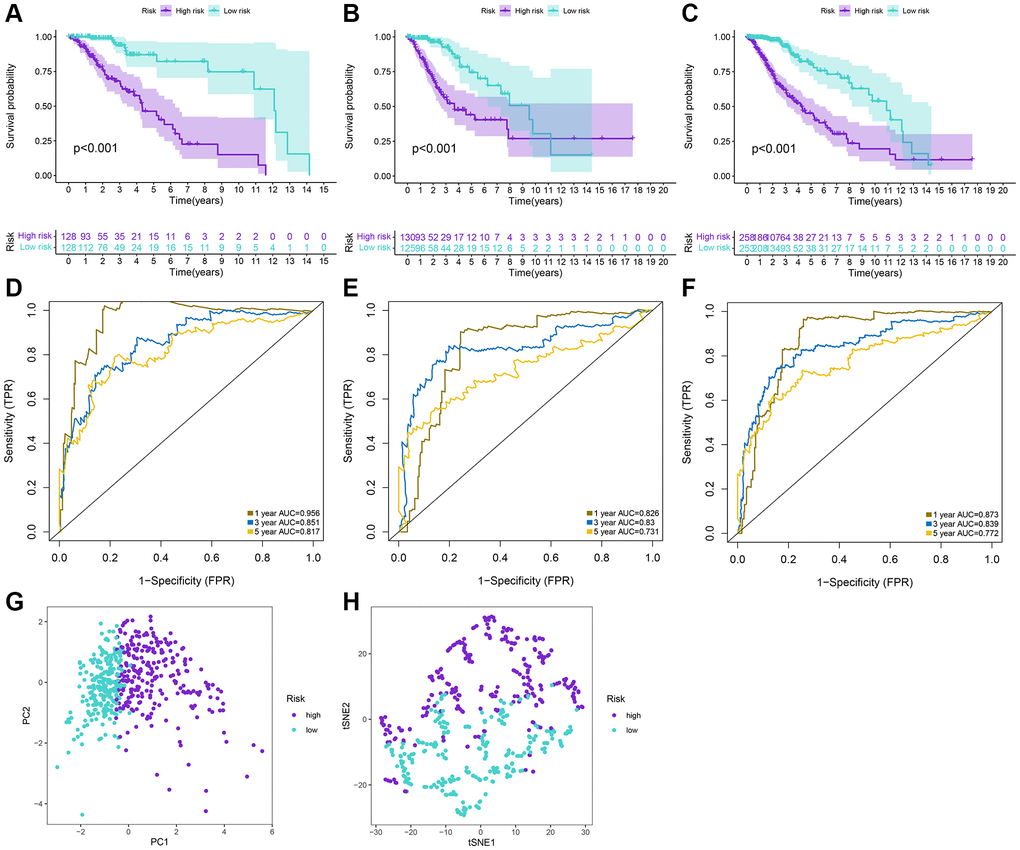
Figure 4.Prediction performances of the signature for LGG patients. (A–C) Kaplan-Meier analysis of high-risk and low-risk patients stratified by the median risk score in the training, test and whole sets. (D–F) Time-dependent ROC curves for 1-year, 3-year, and 5-year OS predictions by the signature in the training, test, and whole sets. (G, H) PCA and tSNE plots for LGG patients based on the risk groups.