Submit an Article
Navigate
Home
Editorial Board
Editorial Policies
Current Volume
Archive
Scientific Integrity
Publication Ethics Statements
Interviews with Outstanding Authors
Newsroom
Sponsored Conferences
Podcast
Contact
Special Collections
Submit an Article
Online ISSN: 1945-4589
Research Paper
|
Volume 14, Issue 2
|
pp. 826–844
A new signature based on alternative polyadenylation for prognostic prediction and therapeutic responses in low-grade glioma
Back to article
Figure 2
(2 of 10)
−
100%
+
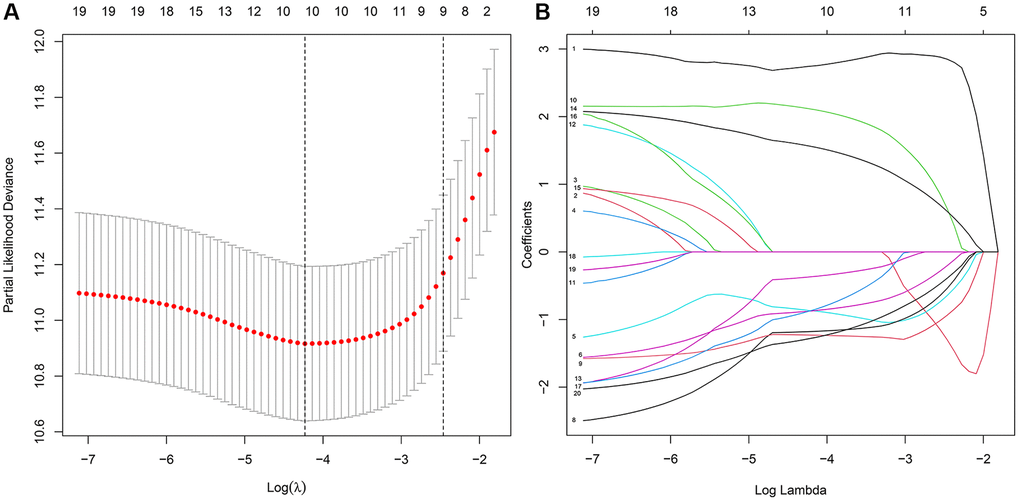
Figure 2.
The key features were identified using LASSO regression.
(
A
) Selection of the optimal parameter (lambda) via 5 times cross–validation. (
B
) LASSO coefficient profiles of the top 20 prognosis-related APA events.