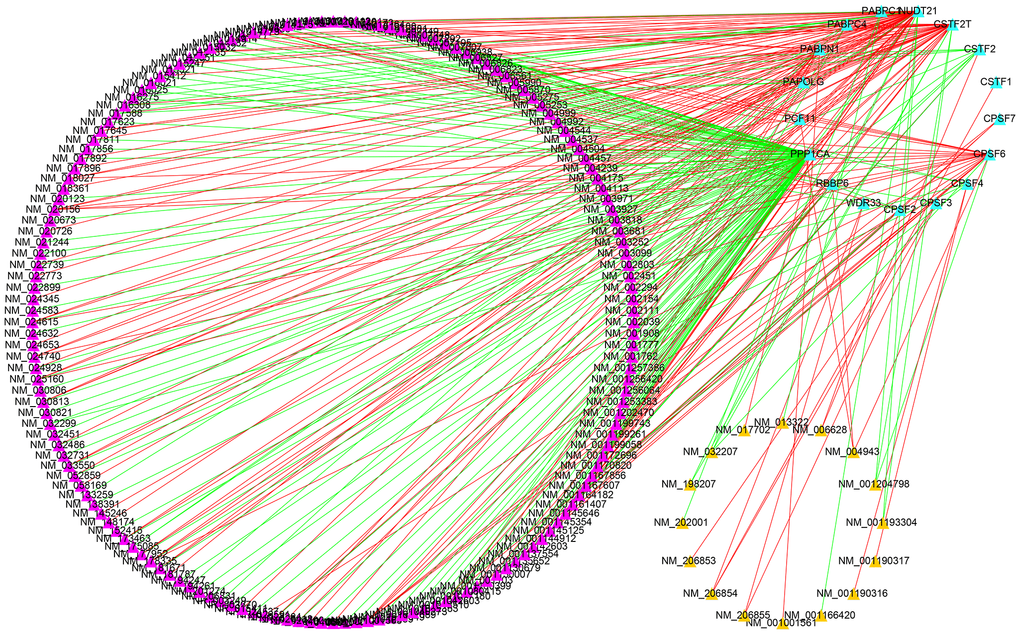
Figure 10.Construction of a survival-associated CRs-APAs network. Blue triangles, purple triangles and yellow triangles were CRs, good prognosis events and poor prognosis, respectively. Red/green lines represent positive/negative correlations between nodes.