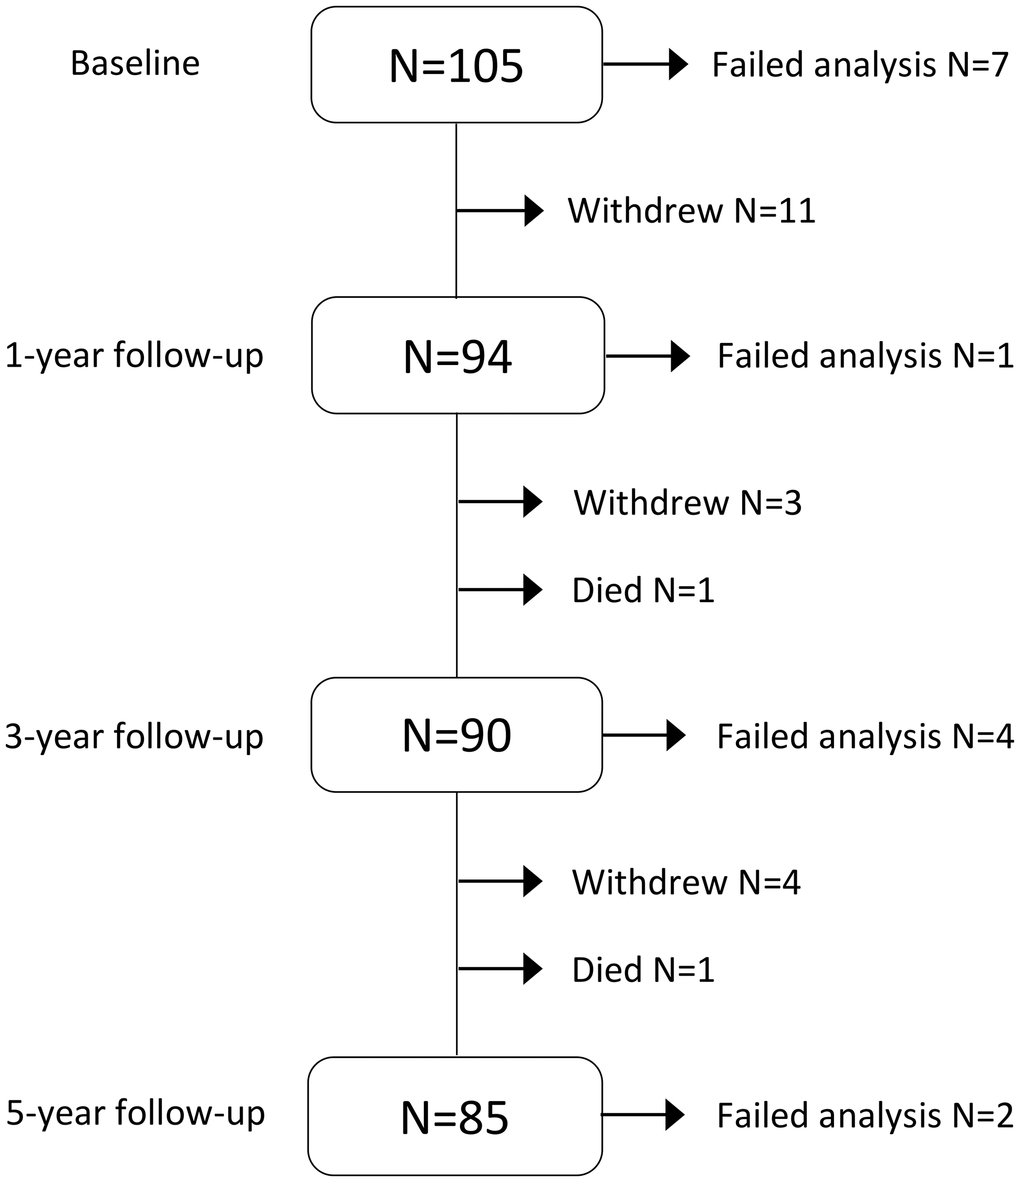
Figure 1.Flowchart of participation, attrition and MRI data included in statistical analysis during the five-year intervention. Failed analysis included corrupted images, motion or other artifacts interfering with manual delineation and/or automated analysis (Figures 3 and 4).