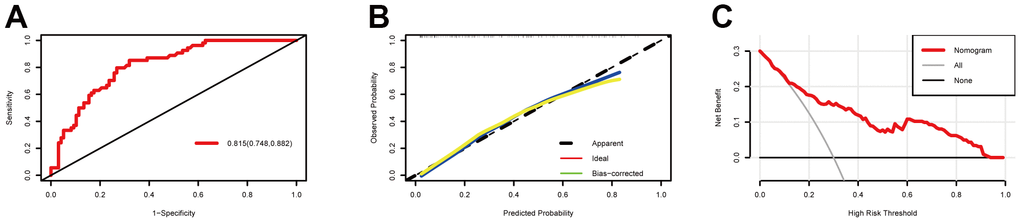
Figure 3.Model discrimination and performance in the training set. (A) Receiver operating characteristic curves for nomogram-based prognostic prediction. (B) Calibration plot examining estimation accuracy. (C) Decision curve analyses assessing clinical utility.