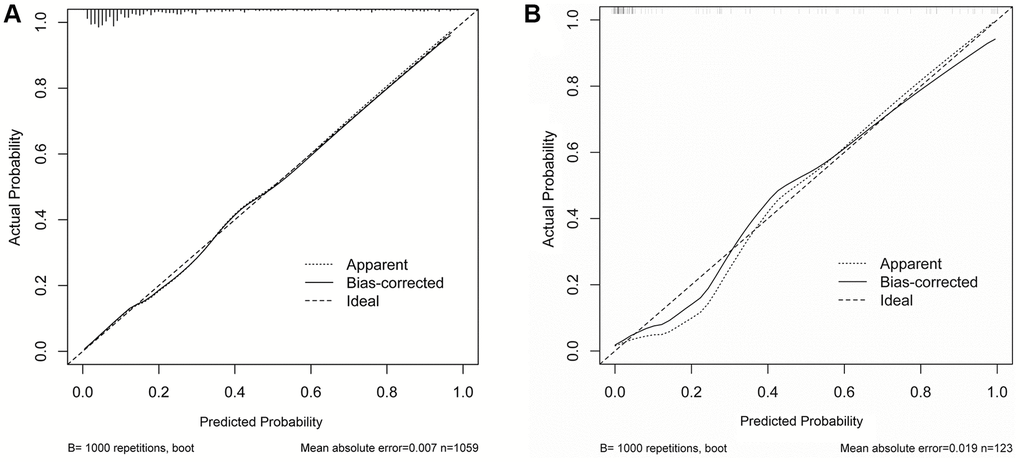
Figure 2.The calibration curves of nomogram in prewarning the severe infection occurrence. Nomogram predicted severe type risk was plotted on x-axis, the actual disease progression probability was plotted on y axis. (A) Training cohort; (B) Validation cohort.