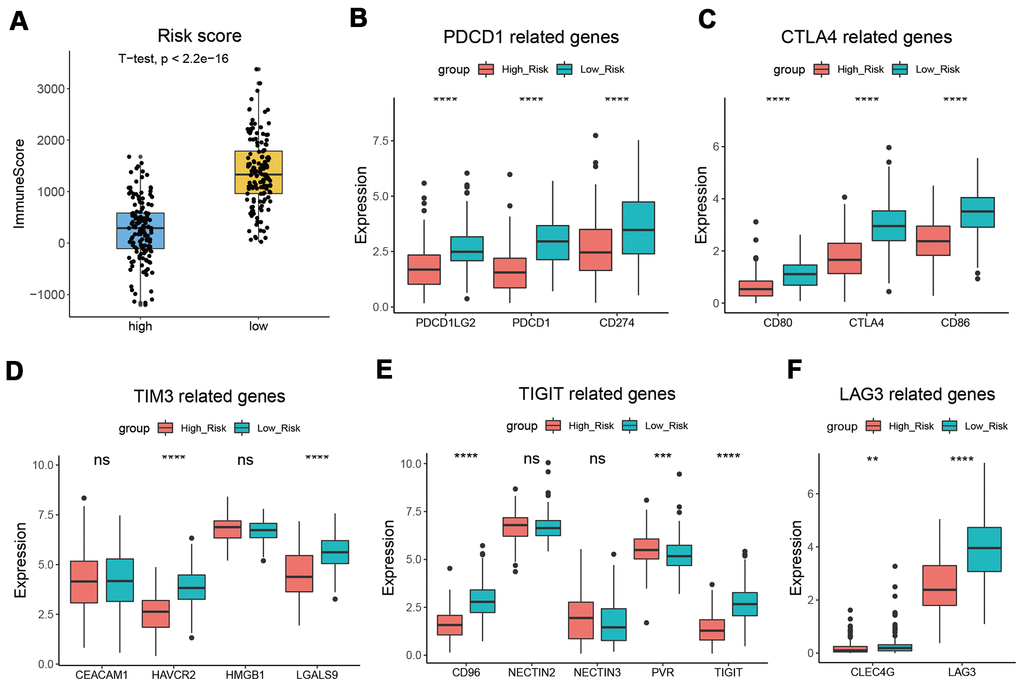
Figure 6.CESC with low-risk score had a higher immune score. (A) Patients from the low-risk subgroup had significantly higher immune scores than those from the high-risk subgroup. (B–F) The expression levels of PDCD1 (B), CTLA4 (C), TIM3 (D), TIGIT (E), LAG3 (F), and their related genes. *, p < 0.05; **, p < 0.01; ***, p < 0.001; ****, p < 0.0001.