Submit an Article
Navigate
Home
Editorial Board
Editorial Policies
Current Volume
Archive
Scientific Integrity
Publication Ethics Statements
Interviews with Outstanding Authors
Newsroom
Sponsored Conferences
Podcast
Contact
Special Collections
Submit an Article
Online ISSN: 1945-4589
Research Paper
|
Volume 13, Issue 22
|
pp. 24710–24739
Detection of genomic structure variants associated with wrinkled skin in Xiang pig by next generation sequencing
Back to article
Figure 4
(4 of 6)
−
100%
+
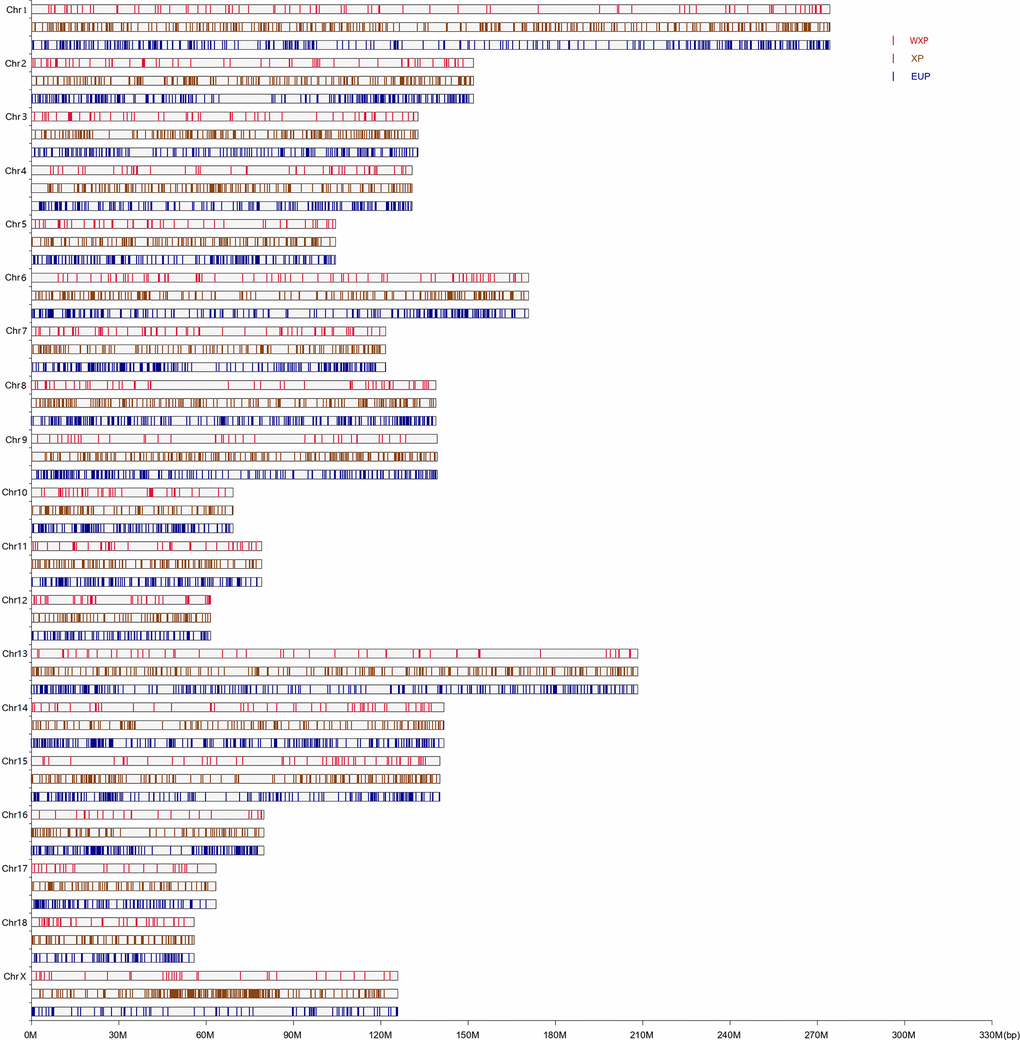
Figure 4.
The chromosome distribution of the group-specific in WXP, XP, and EUP pig group.
The vertical bars indicated different pig group with the crimson, saddle brown and dark blue color for WXP, XP and EUP, respectively.