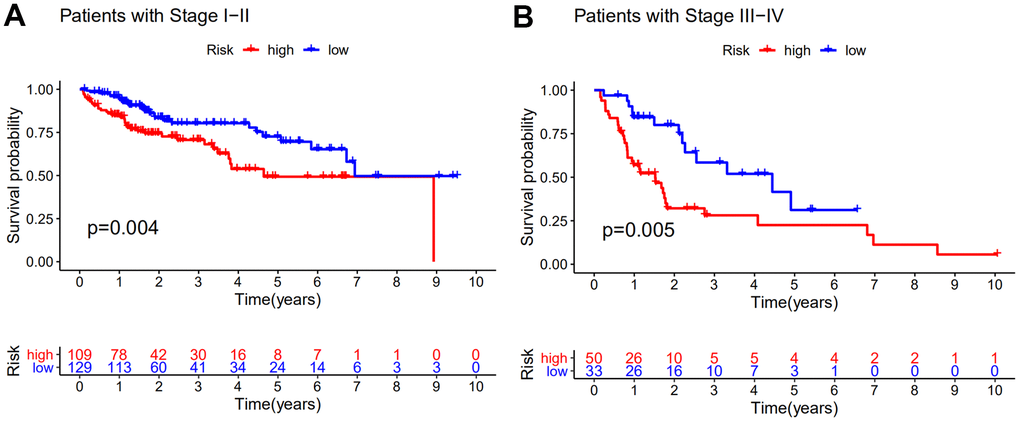
Figure 4.Stratification analyses by stage. Kaplan–Meier curve analysis of overall survival of patients in high- and low-risk groups for early-stage patients (A) and late-stage patients (B). Statistical analysis was performed using the log-rank test and univariate Cox analysis.