Submit an Article
Navigate
Home
Editorial Board
Editorial Policies
Current Volume
Archive
Scientific Integrity
Publication Ethics Statements
Interviews with Outstanding Authors
Newsroom
Sponsored Conferences
Podcast
Contact
Special Collections
Submit an Article
Online ISSN: 1945-4589
Research Paper
|
Volume 13, Issue 21
|
pp. 24432–24448
Immune cell and TCR/BCR repertoire profiling in systemic lupus erythematosus patients by single-cell sequencing
Back to article
Figure 8
(8 of 9)
−
100%
+
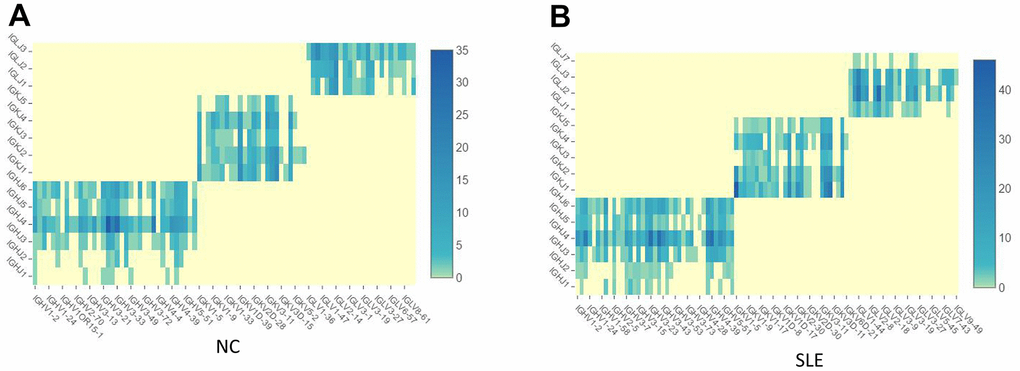
Figure 8.
The BCR clonotypes was increased in SLE than in NC.
(
A
) The heatmap of BCR in the NC group. (
B
) The heatmap of BCR in the SLE group.