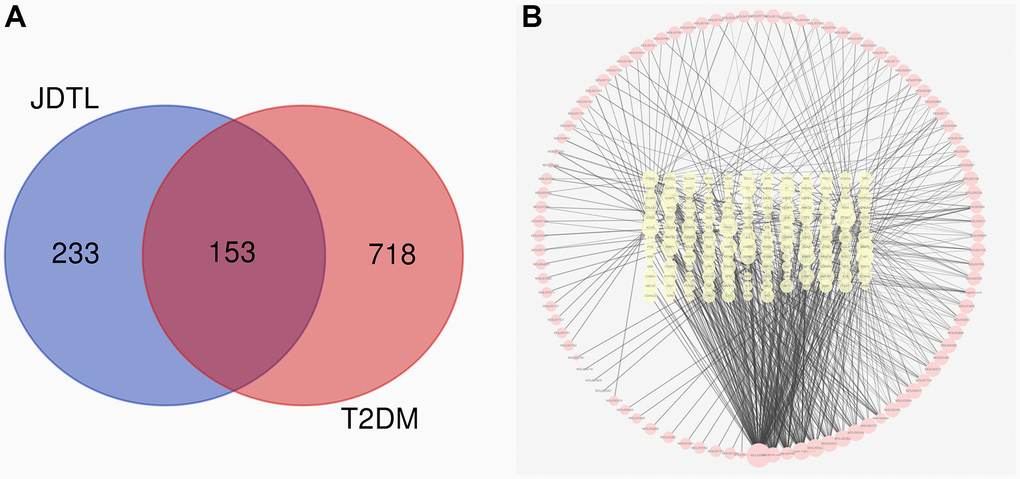
Figure 3.Common targets and common targets-active ingredients network. (A) Venn diagram of common targets. (B) Common targets-active ingredients network. Brick red-colored nodes represent common targets of T2DM and JDTL; yellow nodes represent active ingredients related to common targets.