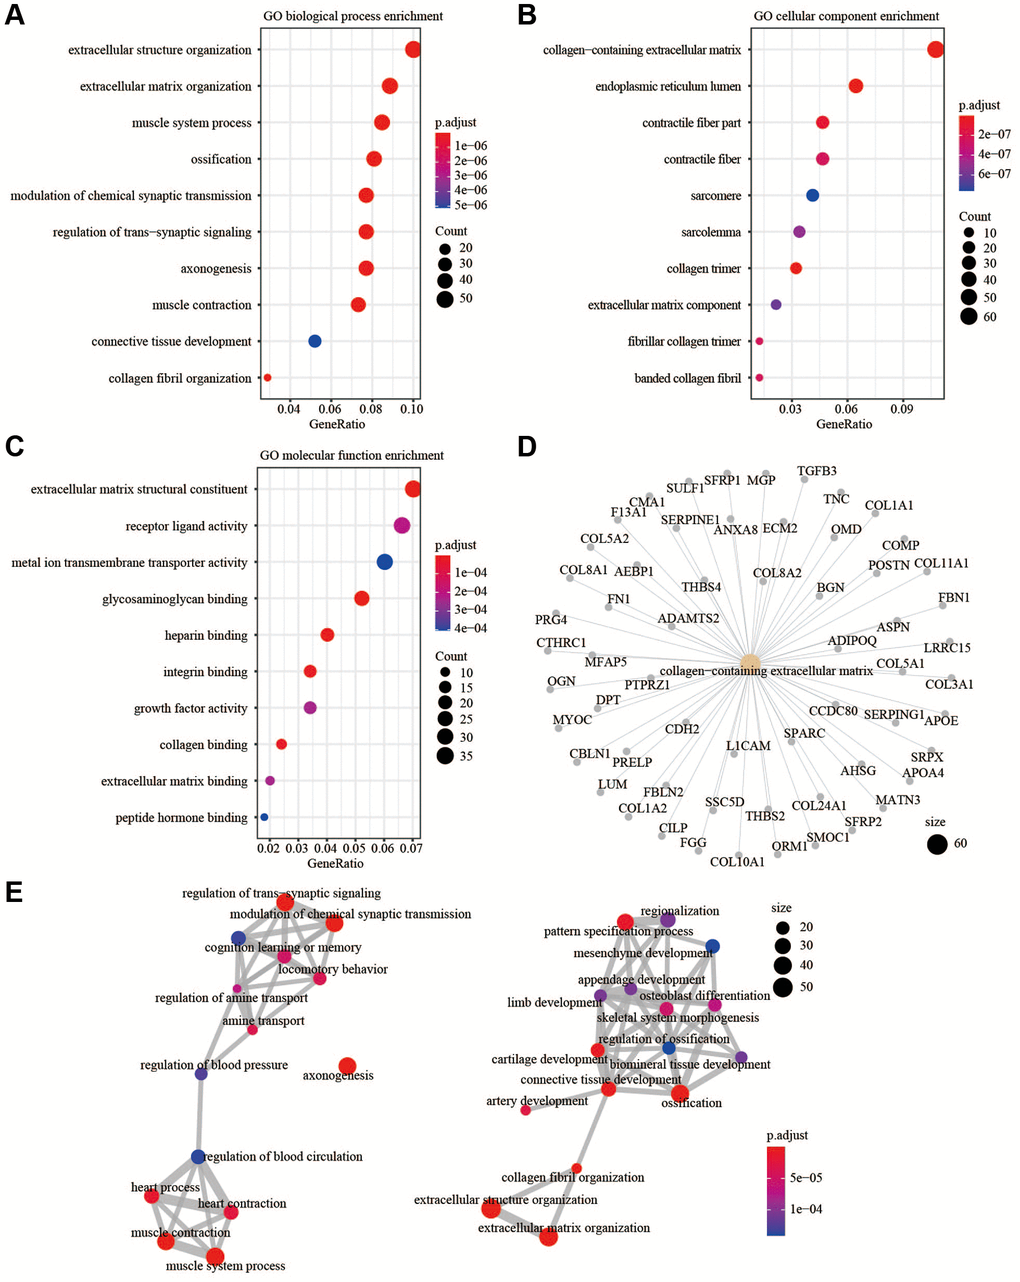
Figure 8.GO enrichment analysis. (A) GO biological process enrichment. (B) GO cellular component enrichment. (C) GO molecular function enrichment. (D) The up-regulated DEGs were related to collagen-containing extracellular matrix. (E) The relationship of different enriched biological processes.