Submit an Article
Navigate
Home
Editorial Board
Editorial Policies
Current Volume
Archive
Scientific Integrity
Publication Ethics Statements
Interviews with Outstanding Authors
Newsroom
Sponsored Conferences
Podcast
Contact
Special Collections
Submit an Article
Online ISSN: 1945-4589
Research Paper
|
Volume 13, Issue 21
|
pp. 24236–24250
The first central precocious puberty proteomic profiles revealed multiple metabolic networks and novel key disease-associated proteins
Back to article
Figure 3
(3 of 7)
−
100%
+
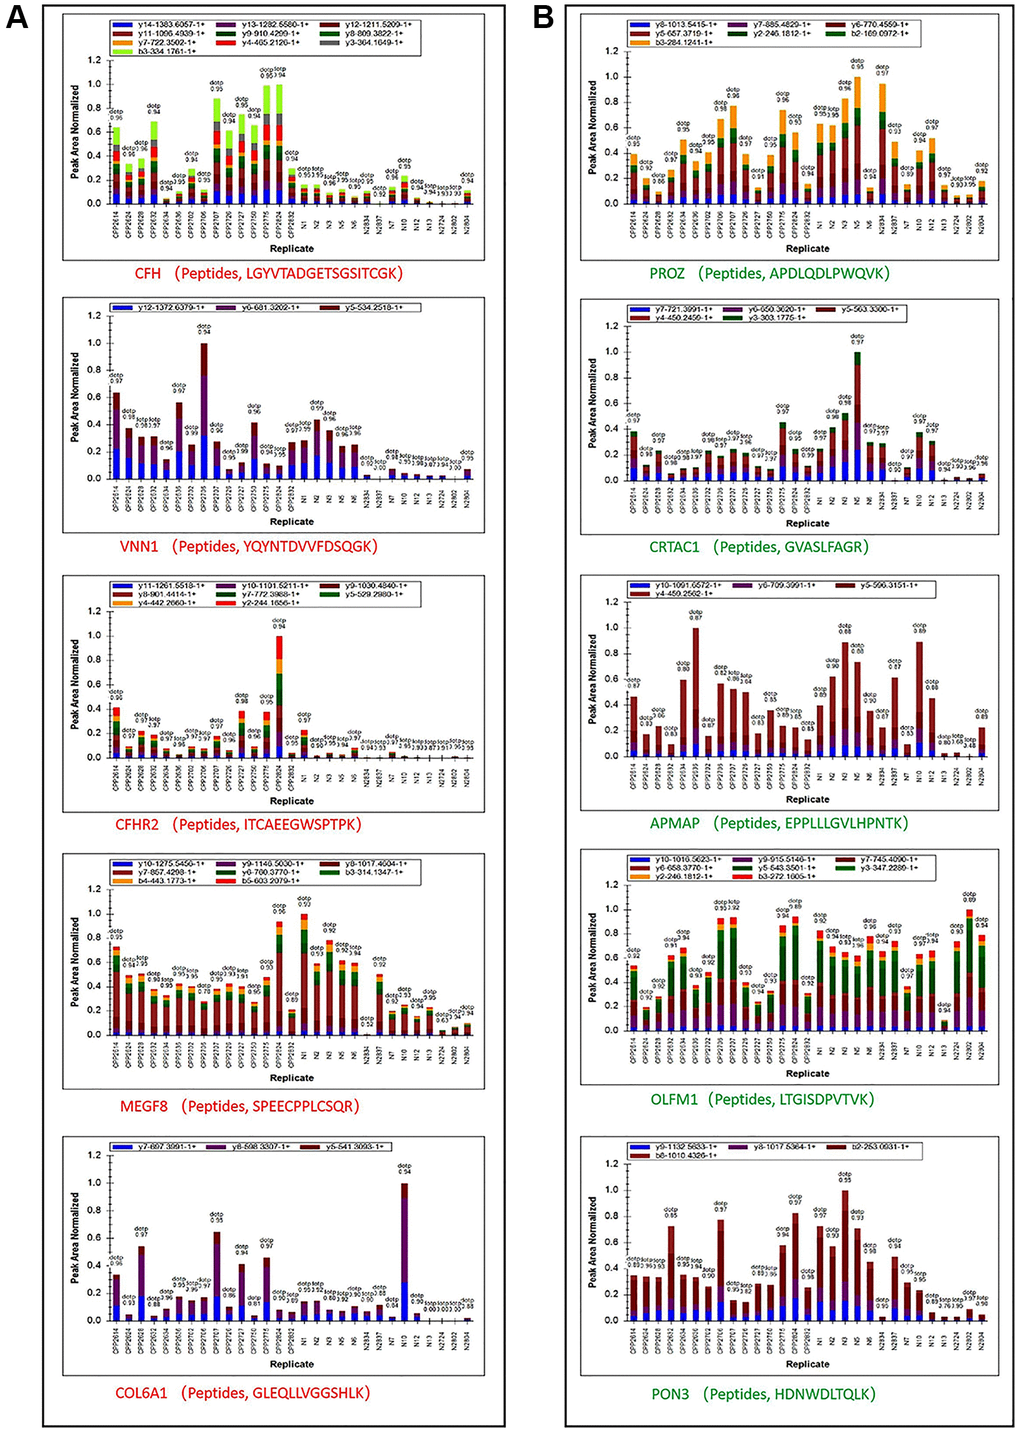
Figure 3.
Peptide ion peak area distribution of PRM.
(
A
) Ion peak area distribution of top 5 up regulated proteins’ peptides. (
B
) Ion peak area distribution of top 5 down regulated proteins’ peptides.