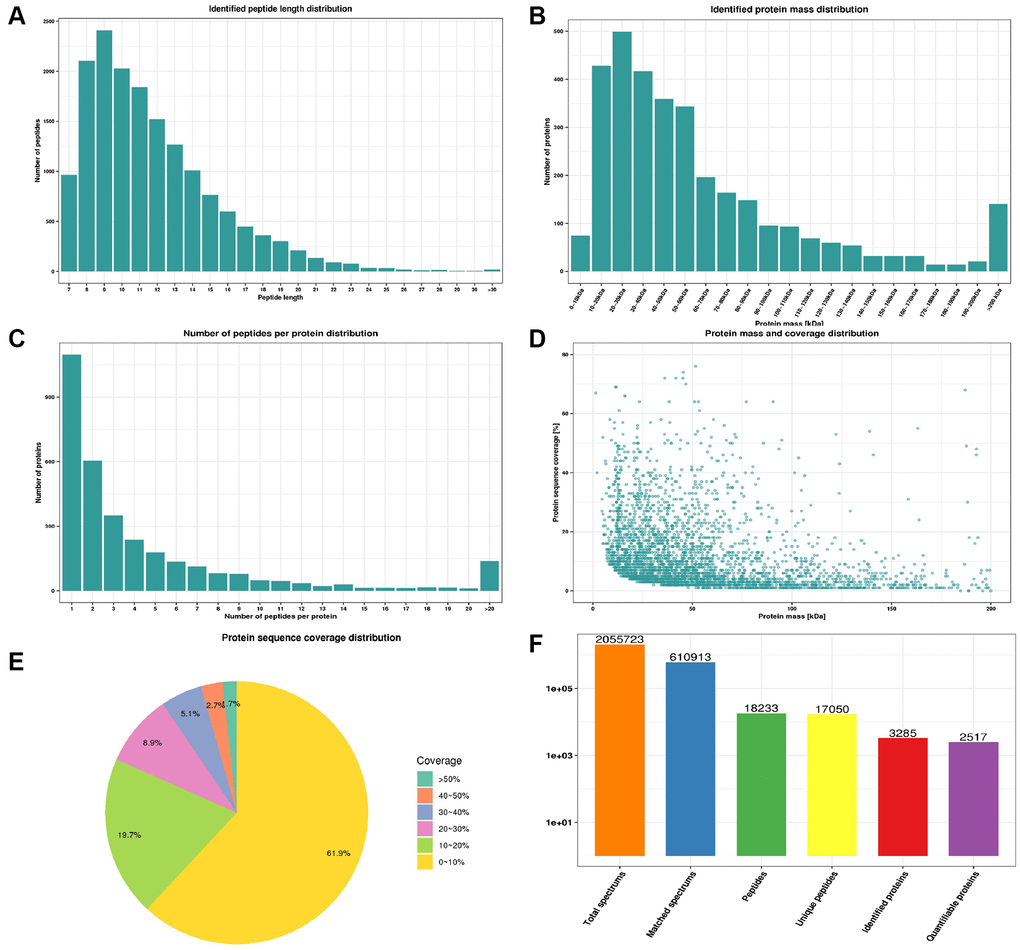
Figure 2.Quality control indexes and proteome landscape between normal and CPP group. (A) Identified peptide length distribution. (B) Identified protein mass distribution. (C) Number of peptides per protein distribution. (D) Protein mass and coverage distribution. (E) Protein sequence coverage distribution. (F) The number of total spectrums, matched spectrums, identified peptides, unique peptides, identified proteins and quantifiable proteins.