Submit an Article
Navigate
Home
Editorial Board
Editorial Policies
Current Volume
Archive
Scientific Integrity
Publication Ethics Statements
Interviews with Outstanding Authors
Newsroom
Sponsored Conferences
Podcast
Contact
Special Collections
Submit an Article
Online ISSN: 1945-4589
Research Paper
|
Volume 13, Issue 21
|
pp. 24219–24235
Construction and external validation of a 5-gene random forest model to diagnose non-obstructive azoospermia based on the single-cell RNA sequencing of testicular tissue
Back to article
Figure 7
(7 of 8)
−
100%
+
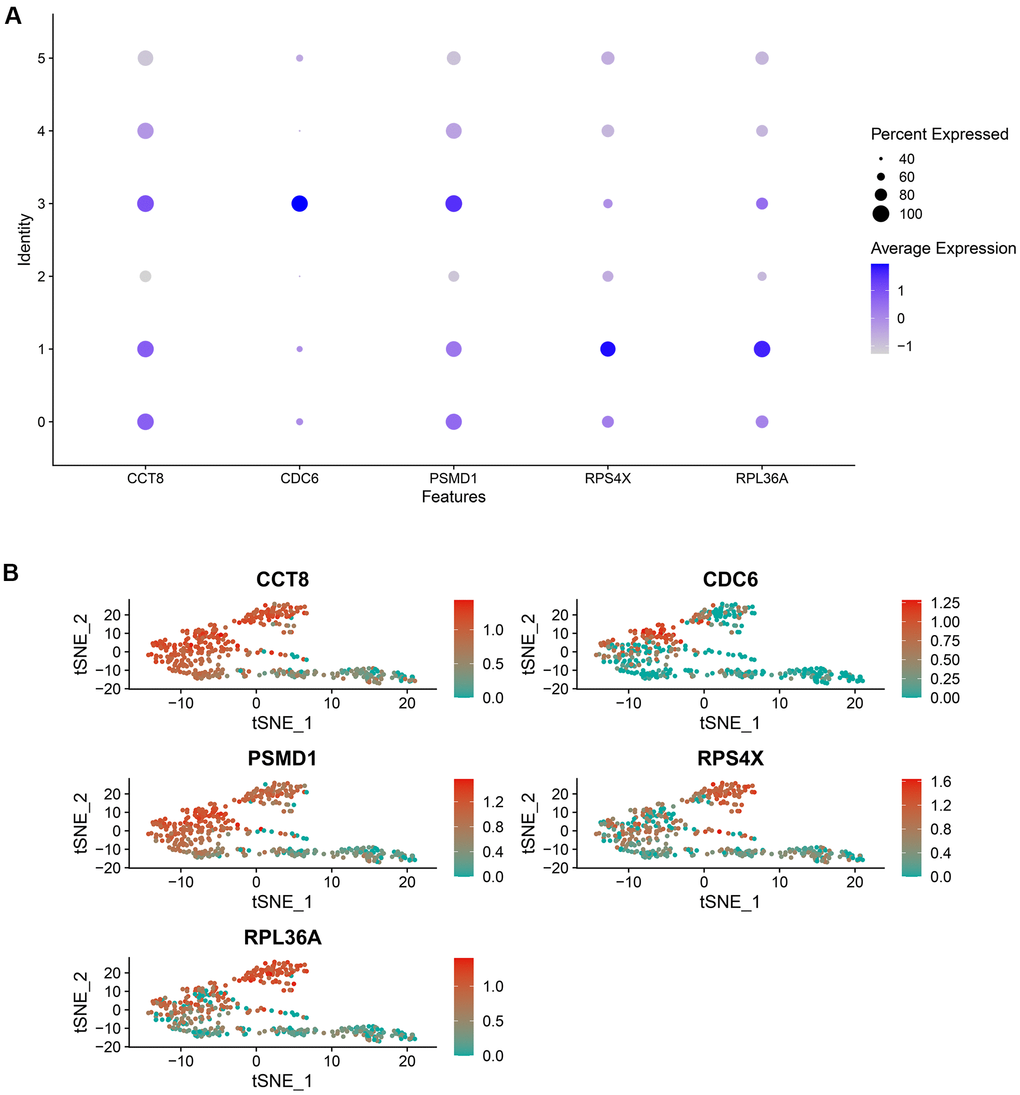
Figure 7.
The expression level of the random forest model’s genes in each cell cluster, which was visualized by a bubble plot (
A
) and a scatter diagram (
B
).