Submit an Article
Navigate
Home
Editorial Board
Editorial Policies
Current Volume
Archive
Scientific Integrity
Publication Ethics Statements
Interviews with Outstanding Authors
Newsroom
Sponsored Conferences
Podcast
Contact
Special Collections
Submit an Article
Online ISSN: 1945-4589
Research Paper
|
Volume 13, Issue 21
|
pp. 24086–24100
Identification of the function and mechanism of m6A reader IGF2BP2 in Alzheimer’s disease
Back to article
Figure 5
(5 of 6)
−
100%
+
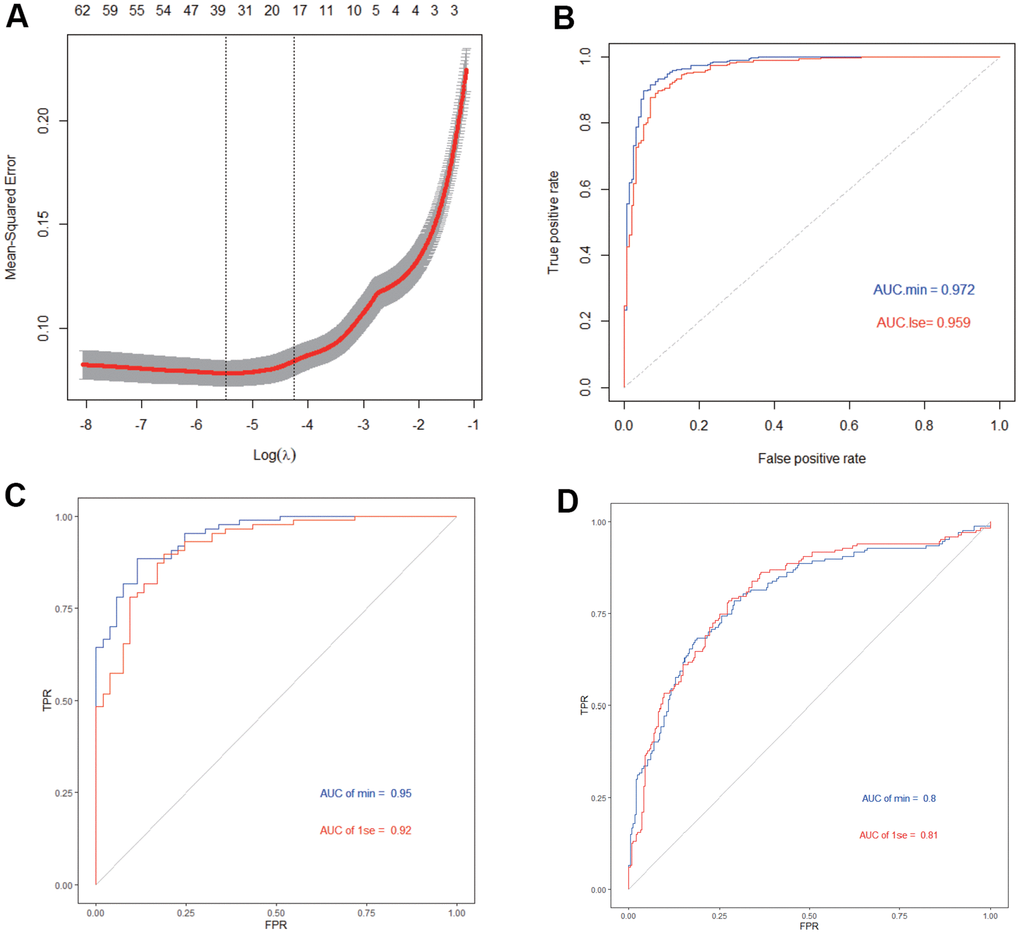
Figure 5.
Construction and validation of AD diagnosis model.
(
A
) LASSO model. (
B
) ROC curves analysis in train set. (
C
) ROC curves analysis in test set. (
D
) ROC curves analysis in validation.