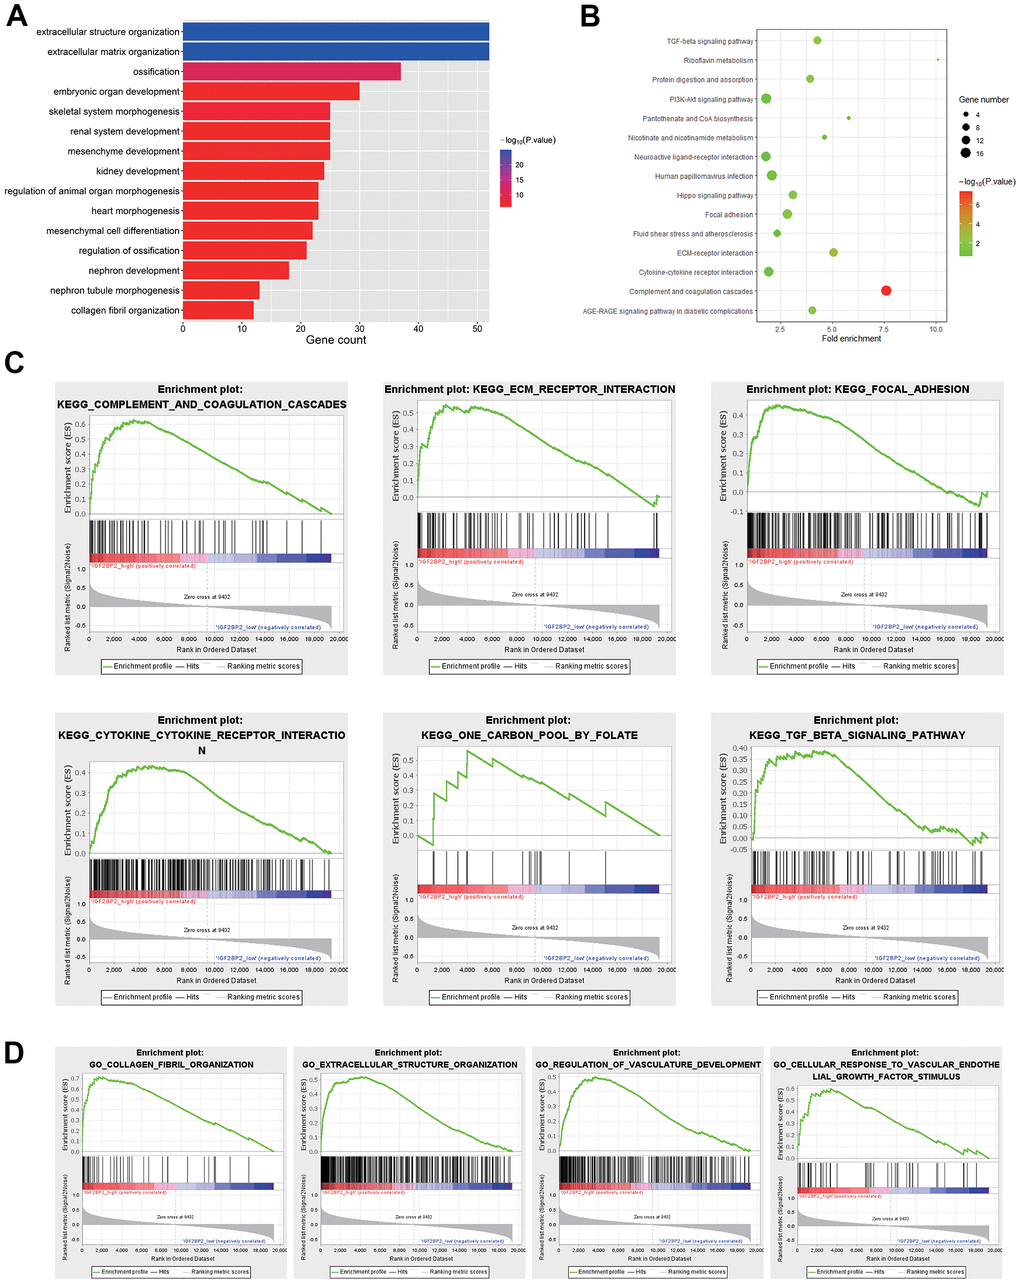
Figure 4.Pathway analysis in DEGS. (A) Biological processes of 440 DEGs in black module. (B) KEGG analysis of 440 DEGs in black module. (C) KEGG pathways enriched in IGF2BP2-high by GSEA. (D) GO biological processes enriched in IGF2BP2-high by GSEA.
Figure 4 — Identification of the function and mechanism of m6A reader IGF2BP2 in Alzheimer’s disease | Aging