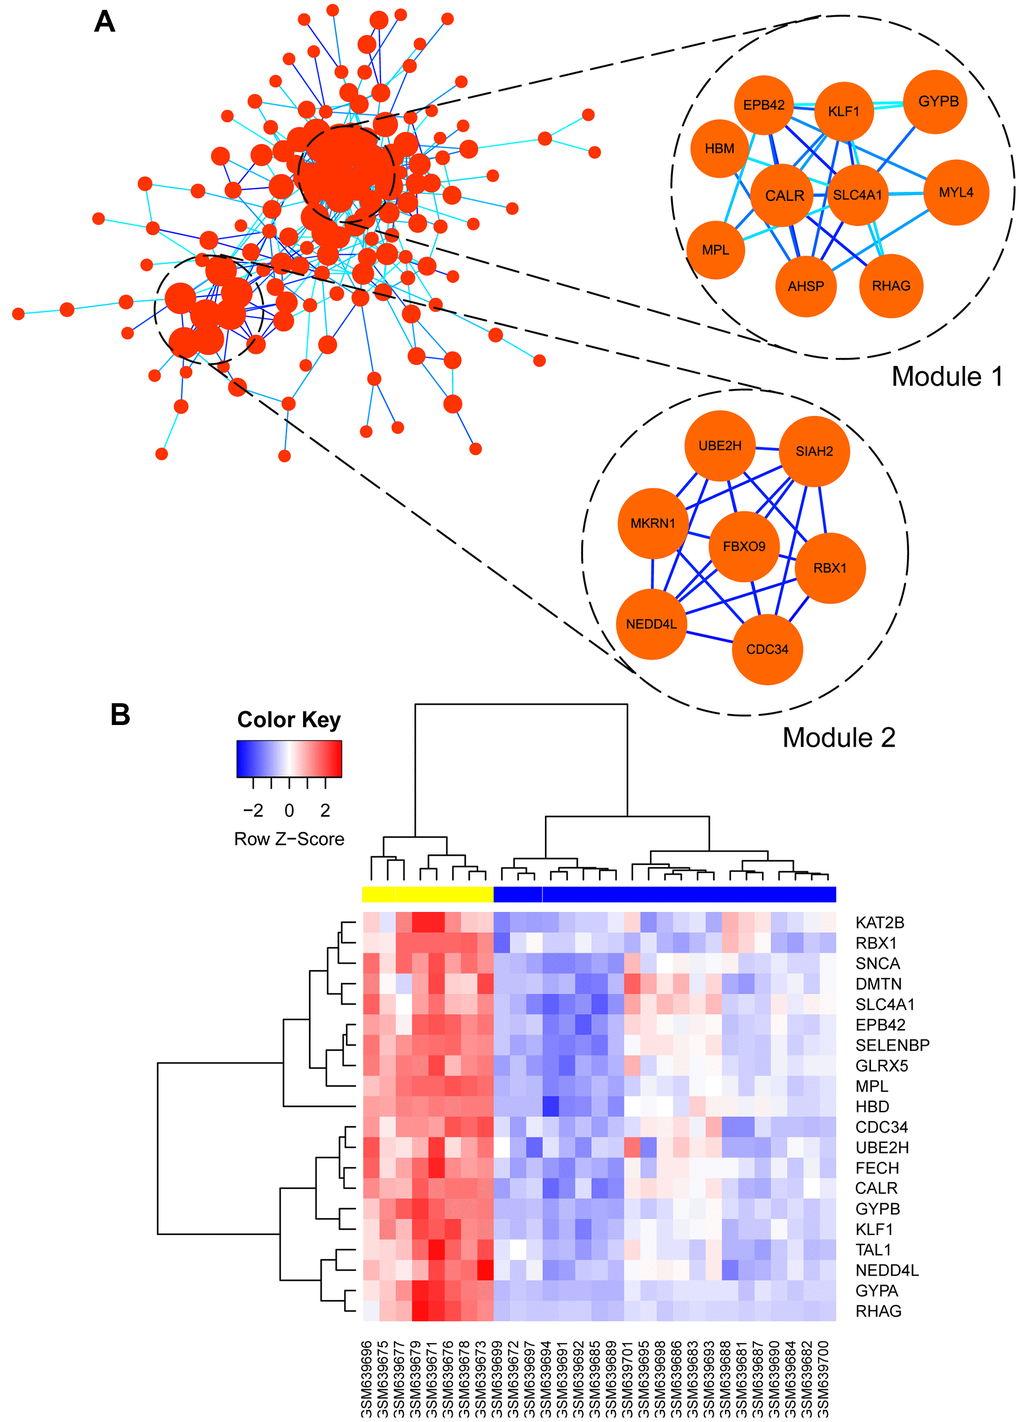
Figure 8.(A) Visualization of protein-protein interaction (PPI) network of genes in green module as well as the top 2 modules from PPI network. Every edge represented the interaction between two genes. (B) hub genes expression heat map identified in green module.