Submit an Article
Navigate
Home
Editorial Board
Editorial Policies
Current Volume
Archive
Scientific Integrity
Publication Ethics Statements
Interviews with Outstanding Authors
Newsroom
Sponsored Conferences
Podcast
Contact
Special Collections
Submit an Article
Online ISSN: 1945-4589
Research Paper
|
Volume 13, Issue 19
|
pp. 22690–22709
Circulating CD5L is associated with cardiovascular events and all-cause mortality in individuals with chronic kidney disease
Back to article
Figure 1
−
100%
+
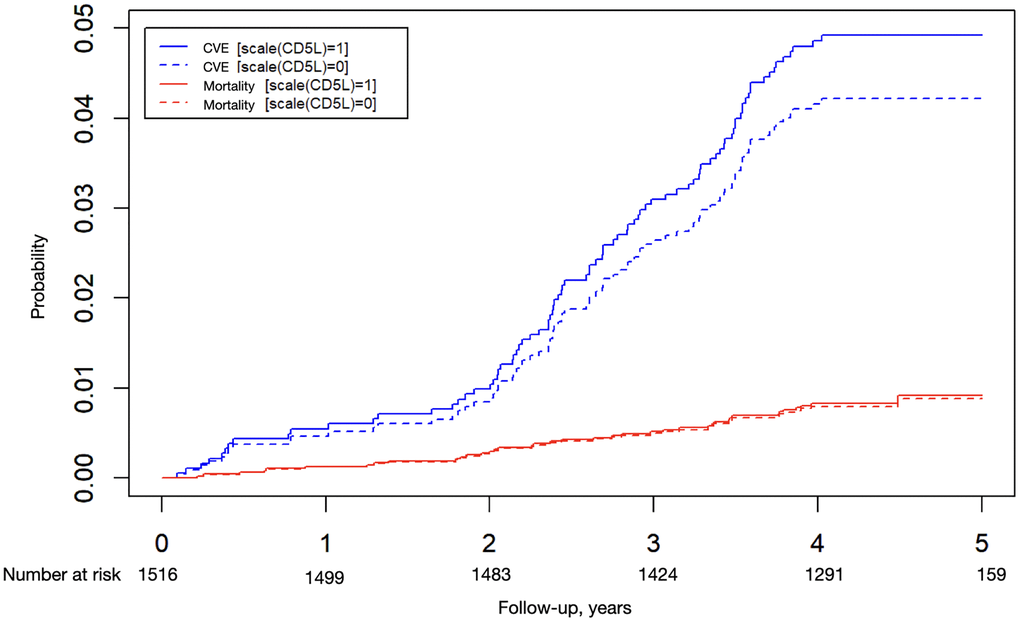
Figure 1.
Probability of a cardiovascular event or all-cause mortality.
Cox models adjusted for competitive risks according to CD5L levels. The continuous line is the median (1) and the dashed line is the median plus one standard deviation (0).