Submit an Article
Navigate
Home
Editorial Board
Editorial Policies
Current Volume
Archive
Scientific Integrity
Publication Ethics Statements
Interviews with Outstanding Authors
Newsroom
Sponsored Conferences
Podcast
Contact
Special Collections
Submit an Article
Online ISSN: 1945-4589
Research Paper
|
Volume 13, Issue 19
|
pp. 23149–23168
Comprehensive analysis of aberrant alternative splicing related to carcinogenesis and prognosis of papillary thyroid cancer
Back to article
Figure 6
(6 of 9)
−
100%
+
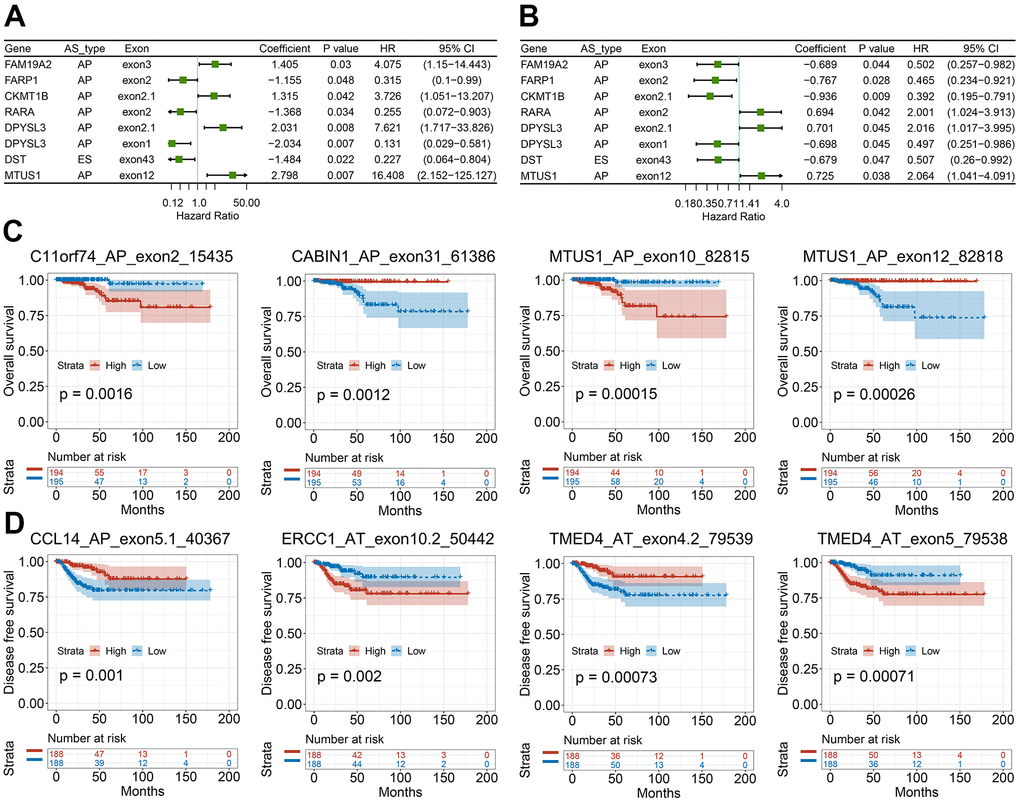
Figure 6.
Survival-associated CASEs in PTC.
(
A
,
B
) Forest plots of hazard ratios for eight CASEs simultaneously associated with OS (
A
) and DFS (
B
). (
C
,
D
) Kaplan-Meier curves of representative genes associated with OS (
C
) and DFS (
D
).