Submit an Article
Navigate
Home
Editorial Board
Editorial Policies
Current Volume
Archive
Scientific Integrity
Publication Ethics Statements
Interviews with Outstanding Authors
Newsroom
Sponsored Conferences
Podcast
Contact
Special Collections
Submit an Article
Online ISSN: 1945-4589
Research Paper
|
Volume 13, Issue 19
|
pp. 23072–23095
Establishment of a novel ferroptosis-related lncRNA pair prognostic model in colon adenocarcinoma
Back to article
Figure 4
(4 of 10)
−
100%
+
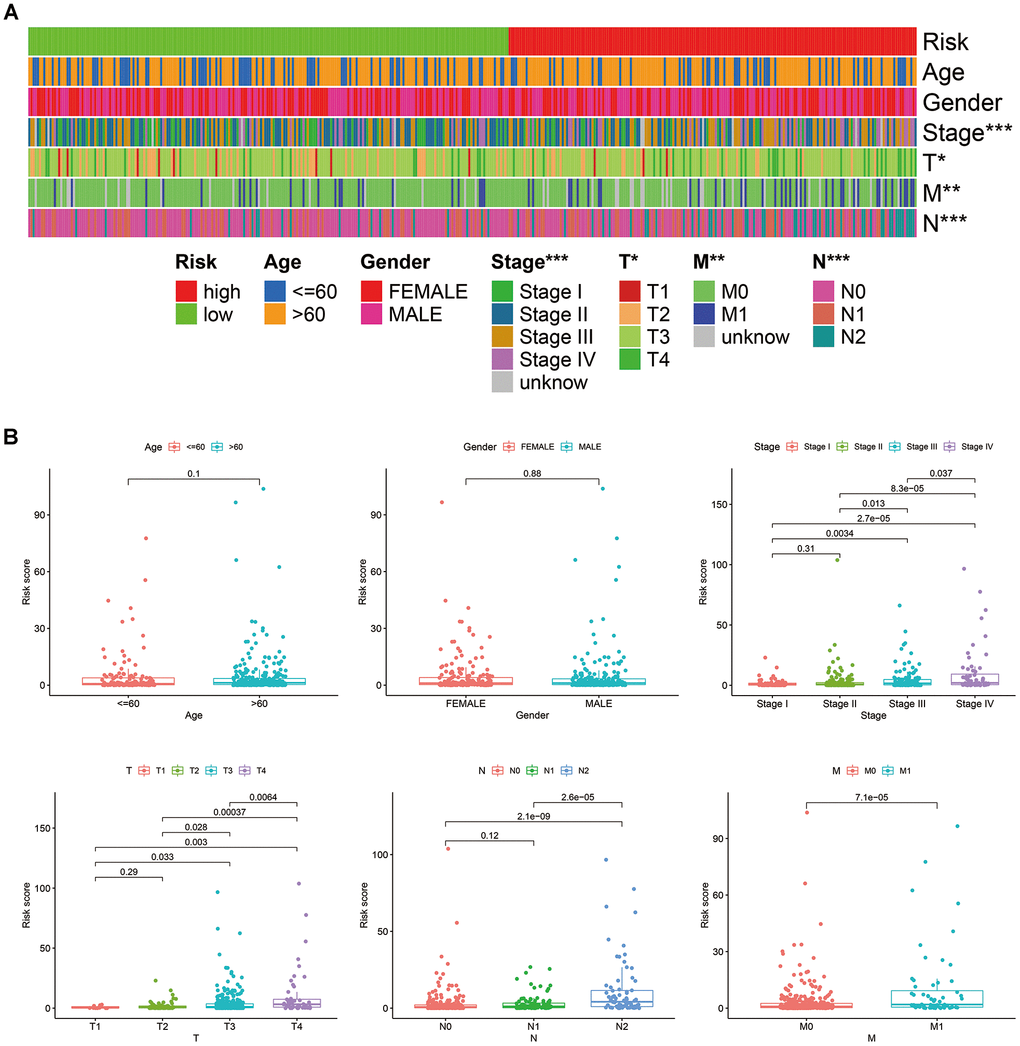
Figure 4.
Correlations between the risk score model and clinicopathological characteristics, represented by a heatmap (
A
), and box diagrams (
B
).