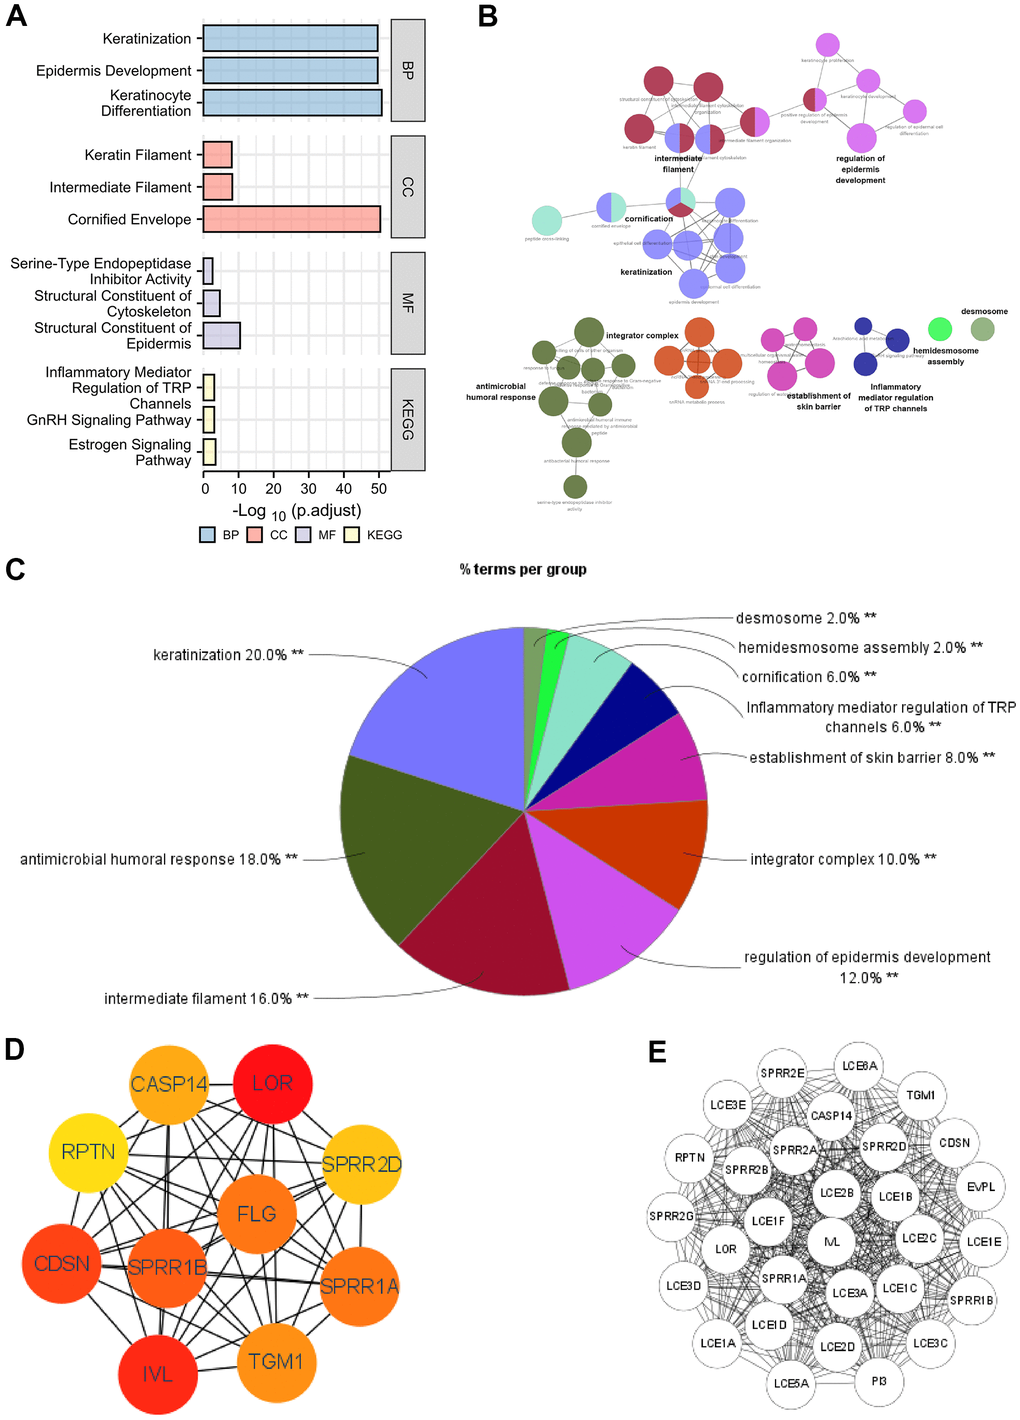
Figure 3.Functional enrichment analysis of DEGs between high and low expression of SERP1 in SKCM patients. (A–C) GO and KEGG pathway enrichment analyses for DEGs between High and -Low expression of SERP1 in SKCM patients. (D) The top 10 hub genes ranked by MCC of cytoHubba, (E) The top 30 hub genes ranked by MCODE.