Submit an Article
Navigate
Home
Editorial Board
Editorial Policies
Current Volume
Archive
Scientific Integrity
Publication Ethics Statements
Interviews with Outstanding Authors
Newsroom
Sponsored Conferences
Podcast
Contact
Special Collections
Submit an Article
Online ISSN: 1945-4589
Research Paper
|
Volume 13, Issue 19
|
pp. 23020–23035
DCP1A is an unfavorable prognostic-related enhancer RNA in hepatocellular carcinoma
Back to article
Figure 2
(2 of 8)
−
100%
+
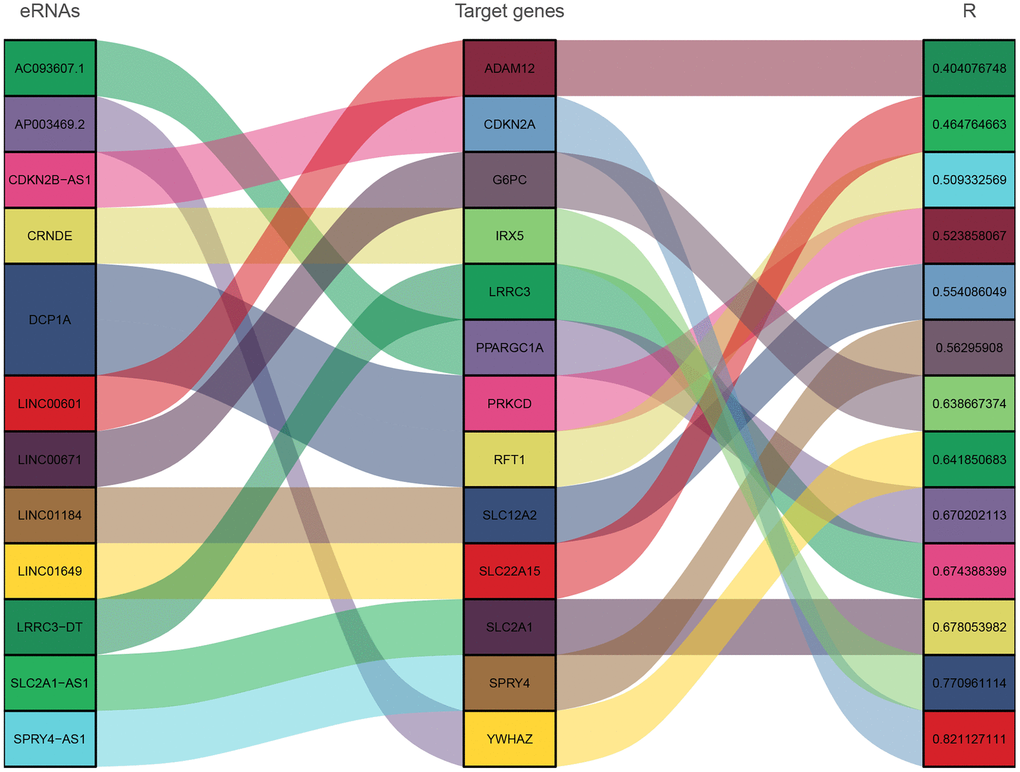
Figure 2.
Sankey diagram showing correlation between eRNAs and target genes.