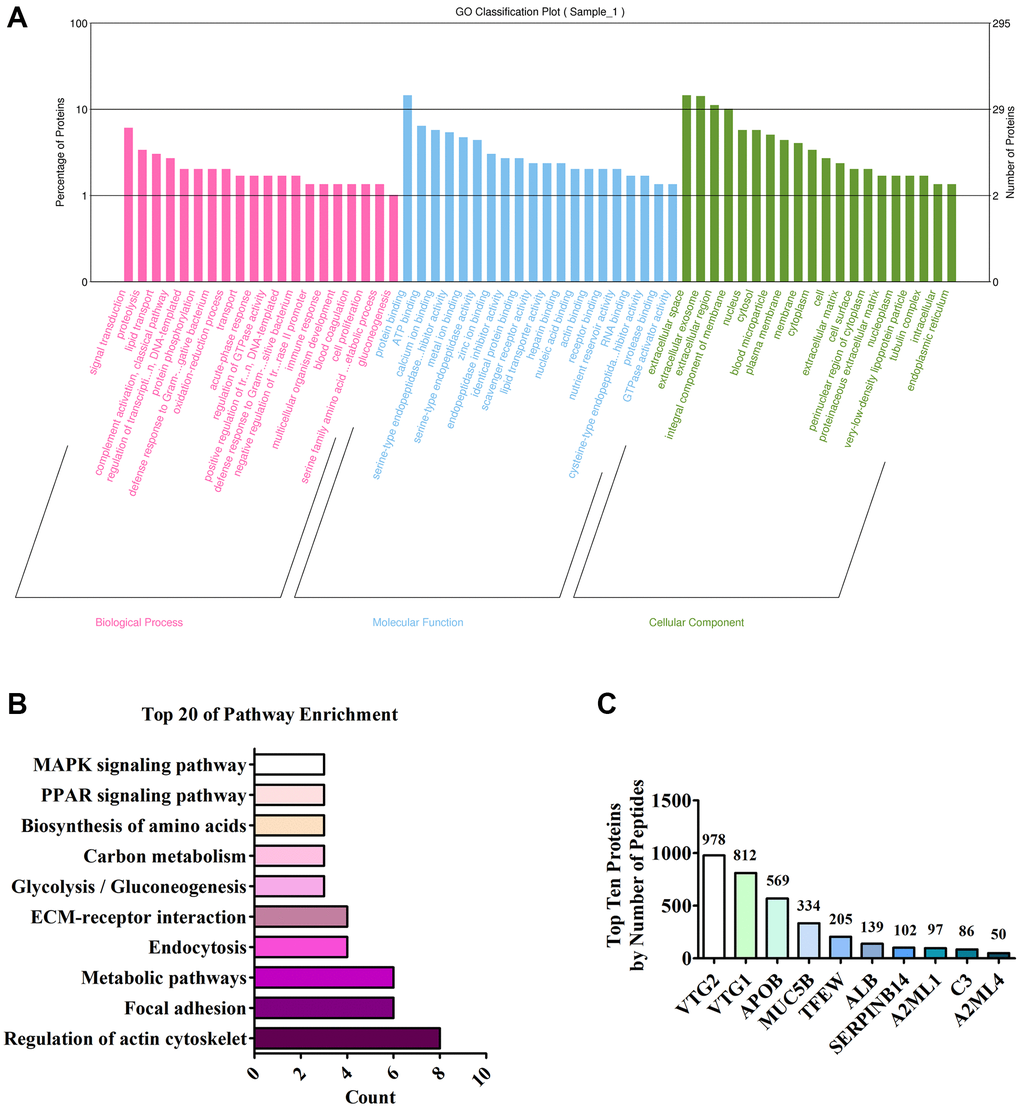
Figure 4.Analysis of LC MS/MS detection results. (A) Annotation of the GO function of the sample; (B) Annotation of the KEGG pathway of the sample; (C) Top ten proteins based on the number of peptides.
Figure 4 — Vitellogenin 2 promotes muscle development and stimulates the browning of white fat | Aging