Submit an Article
Navigate
Home
Editorial Board
Editorial Policies
Current Volume
Archive
Scientific Integrity
Publication Ethics Statements
Interviews with Outstanding Authors
Newsroom
Sponsored Conferences
Podcast
Contact
Special Collections
Submit an Article
Online ISSN: 1945-4589
Research Paper
|
Volume 13, Issue 19
|
pp. 22963–22984
RUNX2 and LAMC2: promising pancreatic cancer biomarkers identified by an integrative data mining of pancreatic adenocarcinoma tissues
Back to article
Figure 3
(3 of 9)
−
100%
+
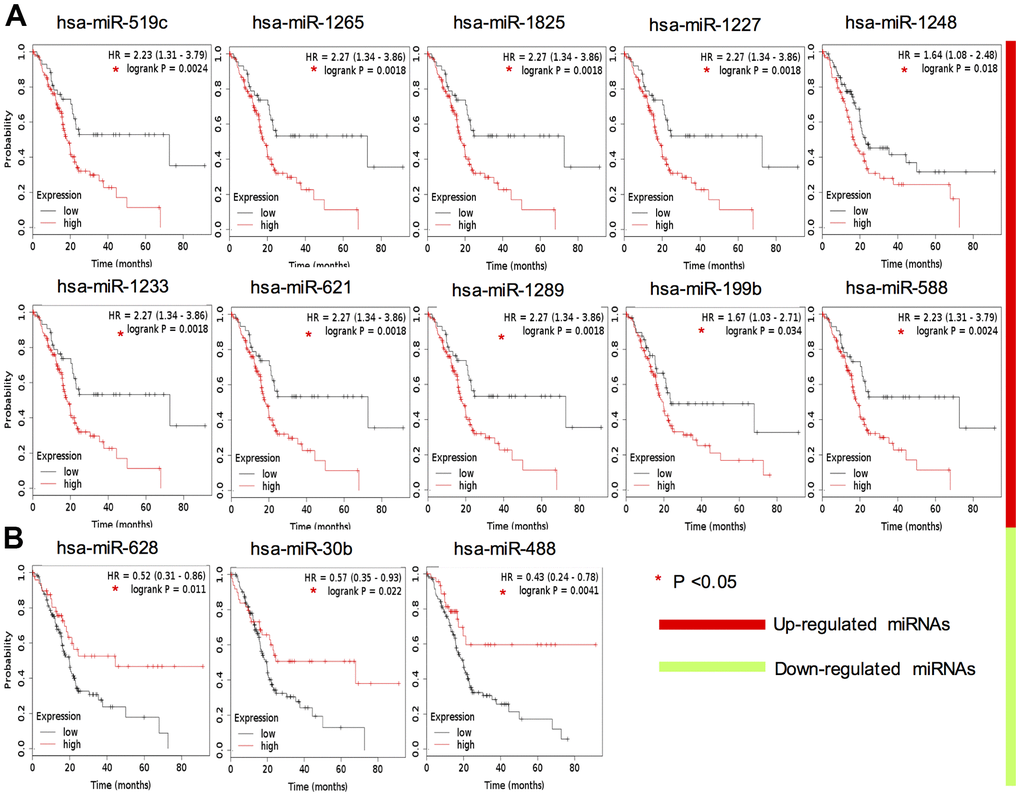
Figure 3.
Survival analysis of 13 key DEMs expression in TCGA PAAD cohort.
Red color indicates upregulation (
A
), whereas green color indicates that the miRNA is downregulated (
B
).