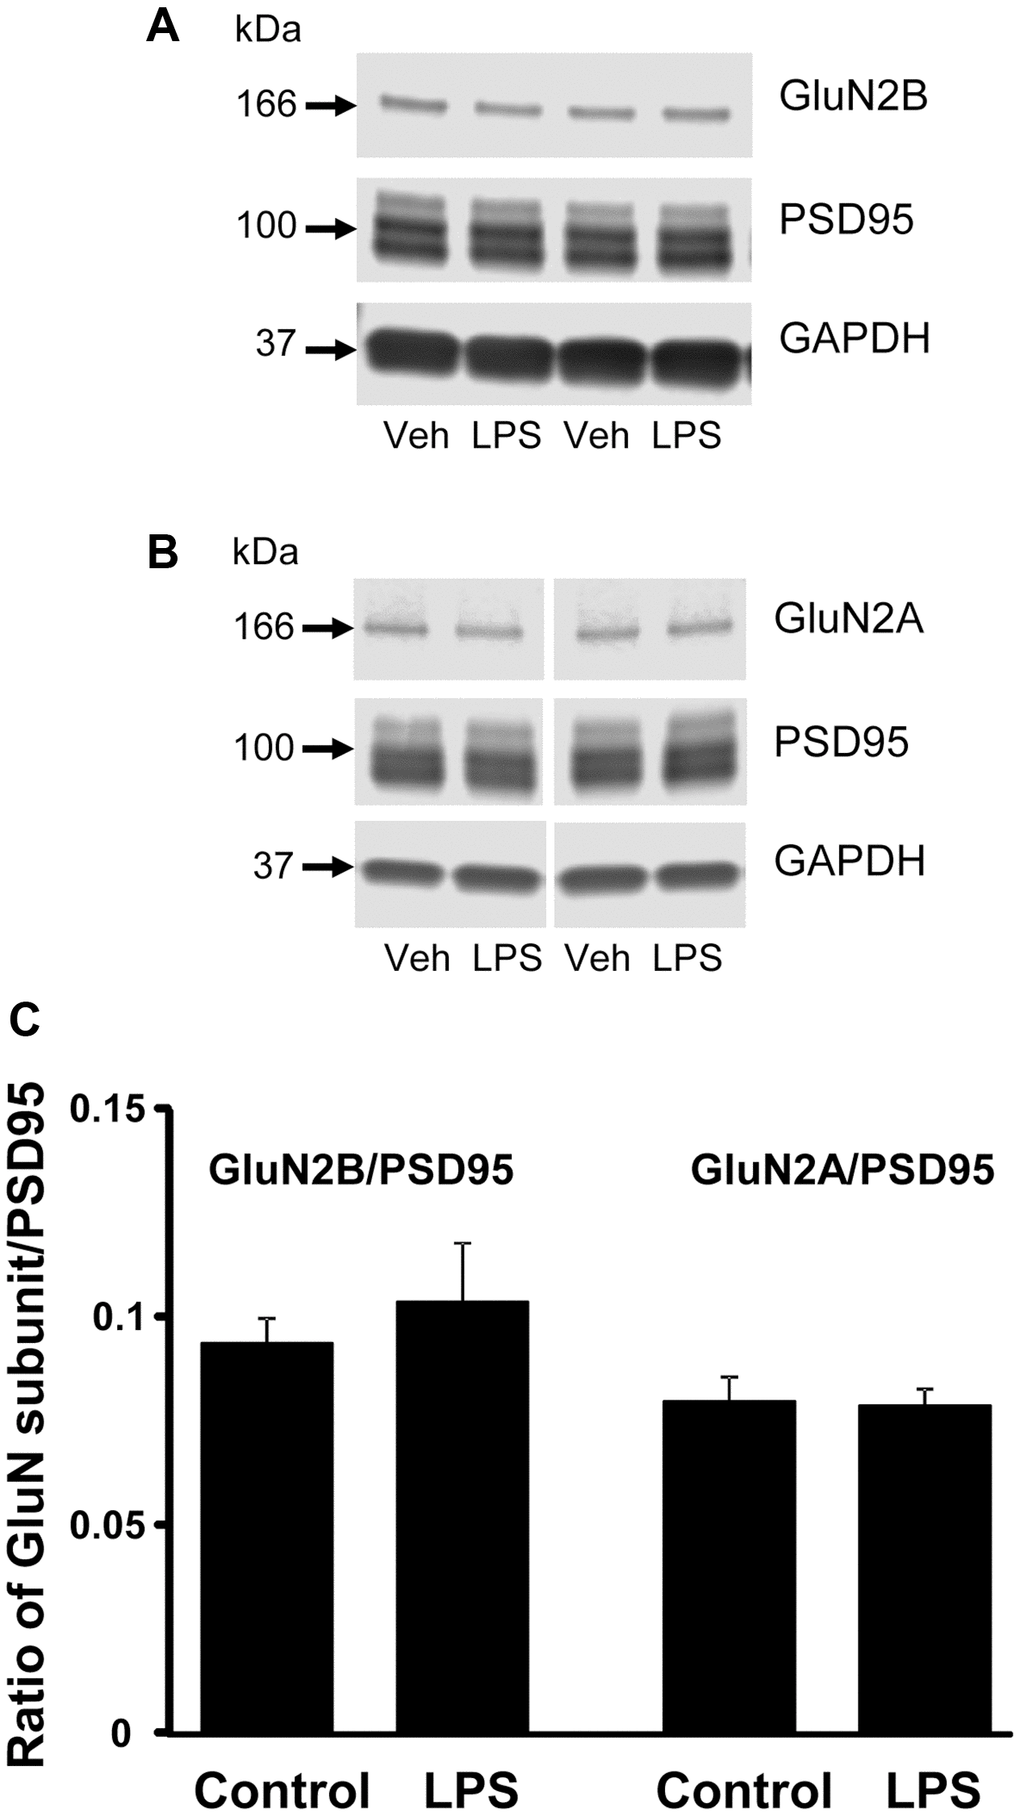
Figure 5.Western blot analysis of NMDAR subunit expression in CA1 region of hippocampus. The blots illustrate expression of (A) GluN2B, (B) GluN2A, and PSD95. (C) The bars represent the mean (± SEM) ratio of expression for vehicle (n = 4) and LPS treated (n = 4) animals.