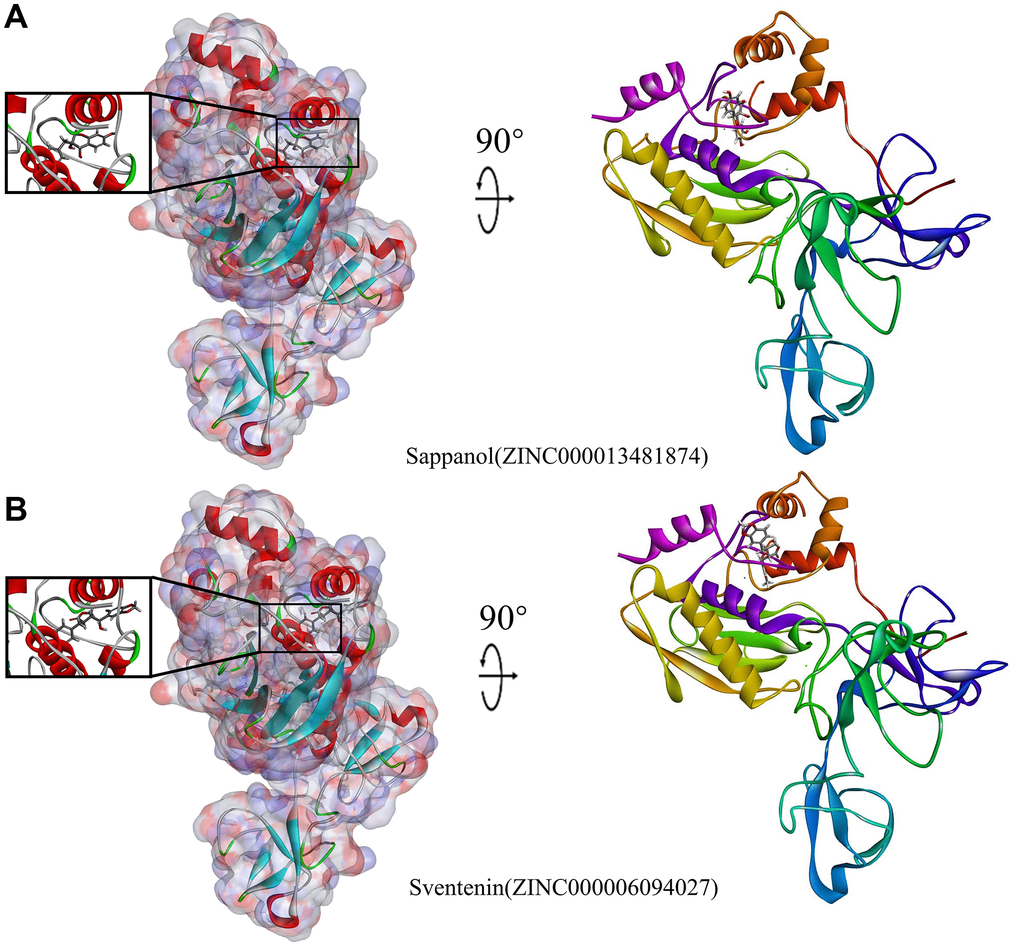
Figure 4.Schematic illustration for MMP9-ligand interactions, showing the surface of the binding areas. Blue and red indicate positive and negative charges, respectively; ligands are shown as sticks, with structures surrounding the ligand-receptor junction displayed as thinner sticks. (A) Sappanol-MMP9 complex. (B) Sventenin-MMP9 complex.