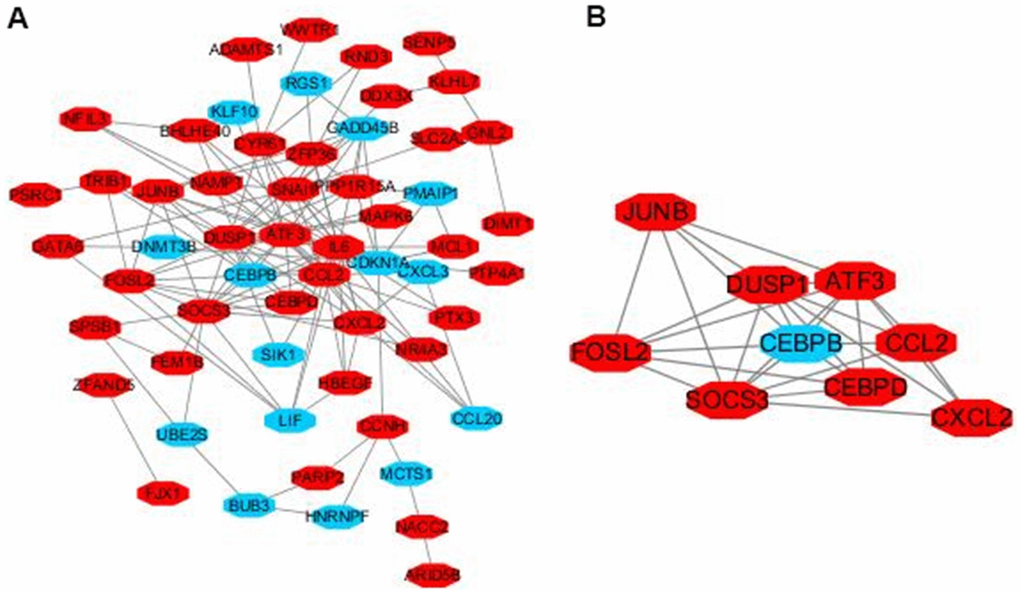
Figure 5.Module analysis of the PPI network. Up-regulated genes are marked in light red, down-regulated genes are marked in light blue (A). The most significant module generated from the PPI network. JUNB, FOSL2, SOCS3, DUSP1, CCL2, CEBPD, CXCL2, ATF3 protein–protein interaction (B). Up-regulated genes are marked in light red, down-regulated genes are marked in light blue.