Submit an Article
Navigate
Home
Editorial Board
Editorial Policies
Current Volume
Archive
Scientific Integrity
Publication Ethics Statements
Interviews with Outstanding Authors
Newsroom
Sponsored Conferences
Podcast
Contact
Special Collections
Submit an Article
Online ISSN: 1945-4589
Research Paper
|
Volume 13, Issue 19
|
pp. 22792–22801
Identification of hub genes and key pathways of paraquat-induced human embryonic pulmonary fibrosis by bioinformatics analysis and
in vitro
studies
Back to article
Figure 4
(4 of 5)
−
100%
+
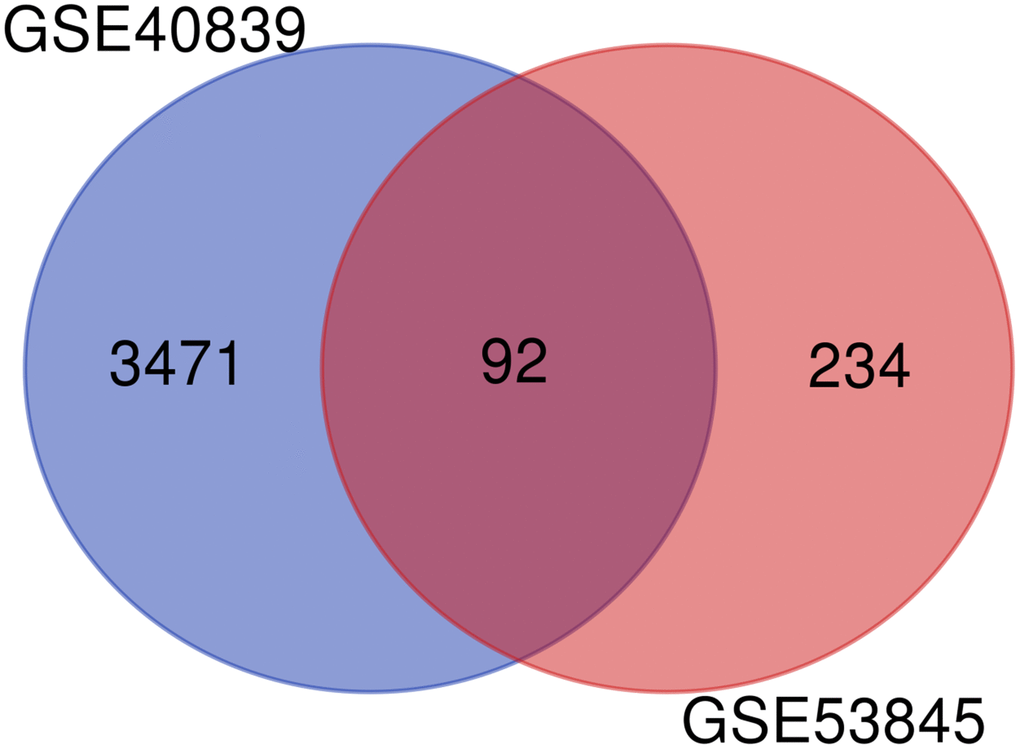
Figure 4.
Venn diagram of DEGs in the two GEO datasets.