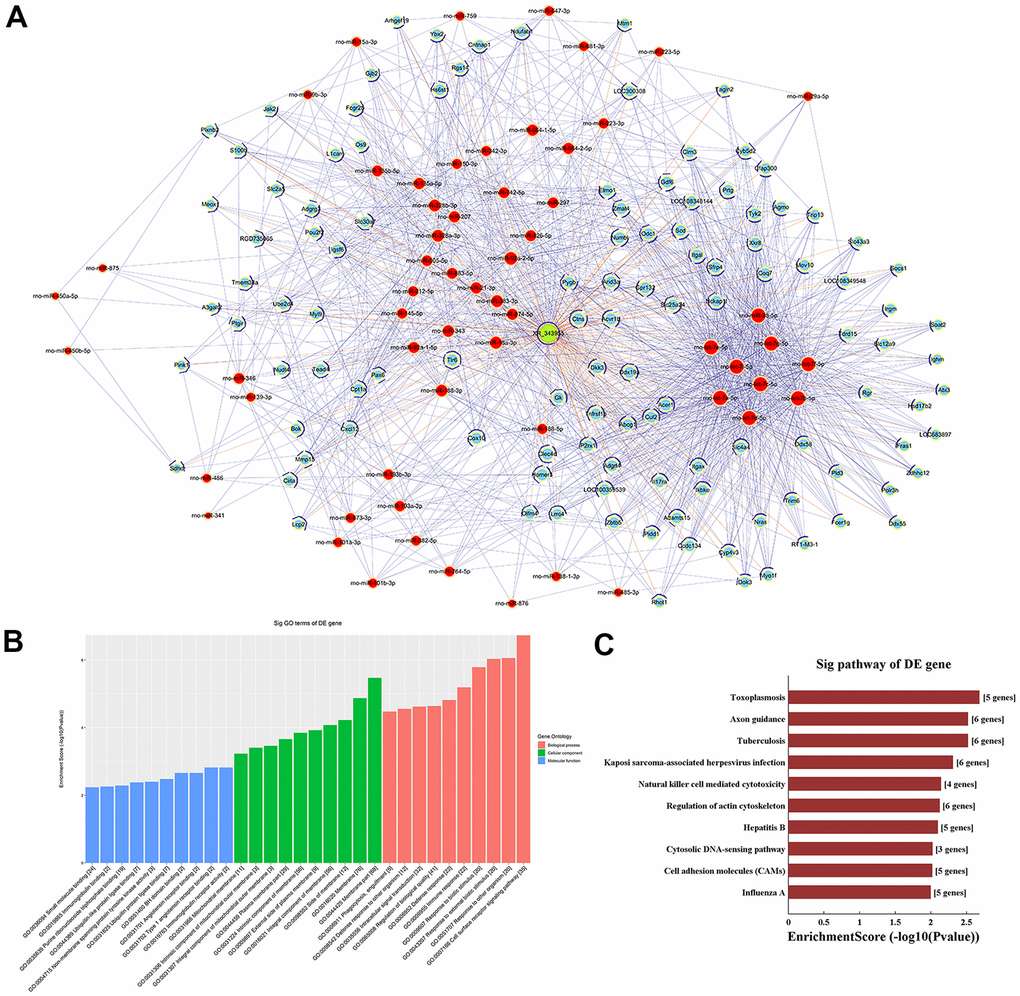
Figure 5.LncRNA-XR_343955-based ceRNA network. (A) XR_343955-associated ceRNA network. Red circles represent miRNAs, blue circles represent mRNAs, and green circles represent lncRNAs. (B) Histogram representation of GO functional classification of predicted mRNAs. (C) Histogram representation of KEGG pathway enrichment for predicted mRNAs.